
Imagine setting a morning alarm. If you always wake up at 7 a.m., a fixed alarm works perfectly. But life isn’t that simple! On weekends, you might wake up at 9 a.m., and after late nights, you may sleep in until 11 a.m. A rigid alarm fails to adapt. This challenge mirrors the problems enterprises face in monitoring their complex IT estates. Just like a fixed alarm, traditional monitoring systems in organizations often struggle to keep up with the dynamic nature of modern IT infrastructure that either creates false alerts or may skip critical issues. The complexity of IT estates, with their constantly changing dependencies and temporal variations, requires smarter and more flexible monitoring solutions. Perhaps, ones that can adapt to fluctuations in system behaviour.
To detect any anomaly in an enterprise IT system, it is important to first define the normal behaviour of an entity. This normal behaviour is then used to define the baseline thresholds which in turn are referred by monitoring tools to generate alerts to report any anomalous behaviour. However, given the dynamic nature of various enterprise IT components, defining this threshold presents several challenges. Failing to address these challenges can either risk in generating too many false alerts or missing out on genuine anomalies. In this blog, we discuss our experiences on defining these normal behaviour thresholds. We present how the process of deriving these thresholds evolves with growing complexity.
Blanket Thresholds based on Subject Matter Expert’s (SME) Tacit Knowledge
A common approach in enterprise monitoring is to set fixed blanket thresholds based on experts’ domain knowledge. For instance, set a fixed threshold of 90% on the CPU utilization of all virtual machines, and generate an alert when the CPU crosses 90%. Subject Matter Experts (SMEs) define these limits using operational experience, aiming to balance alerting accuracy and system stability.
However, such “one-size-fits-all” thresholds often fail to account for real-world variability, assuming uniform behaviour across dynamic and evolving systems overlooking the inherent differences in system behaviour.
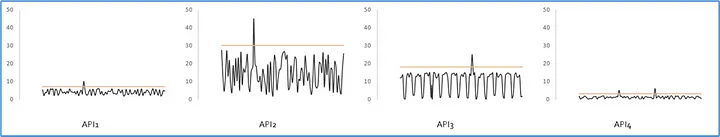
Example:
Following figure shows an example of response time of 4 APIs. Here the SME has used tacit knowledge to set a blanket threshold of 20ms for API response times for all the APIs. As the figure shows, different APIs have different value ranges and setting a blanket threshold of 20ms will generate too many alerts in some APIs, and will miss some genuine anomalies in some APIs.
![]()
Statistical Fixed-value Thresholds
Instead of intuition-driven thresholds, a more promising approach is to adopt data-driven approaches to derive thresholds. The past history of a metric can be analysed to define the normal ranges. These normal ranges can then be used to define the thresholds for generating alerts.
One of the simplest statistical approaches is to define a threshold using standard statistical functions such as mean and standard deviation. For instance, higher threshold is set at mean + 3*standard deviation, and lower threshold is set at mean — 3*standard deviation.
However, several factors need to be considered before applying such statistical measures to define thresholds on real-world data.
- Most enterprise IT components observe changes from time to time. These could be business changes or technology changes. Hence, it is important to first identify the steady state of the metric. Various change detection algorithms can be used to detect significant, persistent changes.
- Once the most recent steady state is identified, then the data of this steady state needs to be analysed to remove noise. Various outlier detection algorithms can be used to detect outliers and remove them before baselining.
- The data also needs to be analysed to look for trends using trend detection algorithms. If an increasing or decreasing trend is present, then it needs to be considered while deriving the baseline thresholds.

This processed time-series can then be used to define the normal behaviour thresholds. Different statistical functions can be used to derive these thresholds. Most common approach is to compute threshold as a function of mean and standard deviation. Other commonly adopted approaches include median and MAD, or quantiles.
Example:
Following figure shows the response time of 4 APIs. Here, instead of a fixed threshold of 20ms, a different threshold is computed for each API response time based on its normal behavior range.
Dynamic Thresholds
Various enterprise IT components demonstrate temporal patterns. For example, an application faces high workload on weekdays and low on weekends, or certain virtual machines demonstrate high CPU utilization in office hours than non-office hours, etc. Static thresholds do not take these patterns into account. Consequently, the thresholds are not an accurate representation of the normal behaviour leading to false alerts or missed alerts. Such situations demand a dynamic threshold, where different thresholds are set for different time-periods.
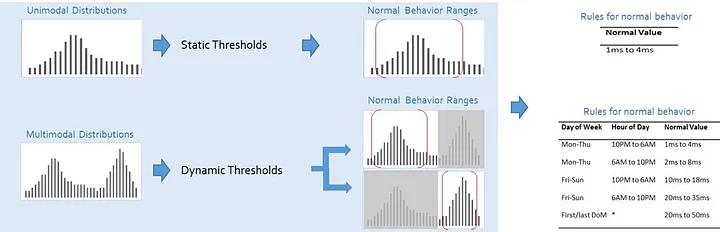
Multi-modal analysis of a metric can help identify if the metric needs a static or a dynamic threshold. In contrast to unimodal distributions, a multimodal distribution features multiple peaks, highlighting varying temporal behaviours, such as differing workloads on weekdays and weekends or peak-hour traffic. Spectral analysis can be done to identify prominent modes. Once these modes are identified, then classification techniques can be used to identify the temporal dimensions that best explain each mode. The temporal dimensions include week of month, day of week, day of month, hour of day, day of week, etc. The modes are often explained using a combination of these temporal dimensions such as day of week of month, or hour of day of week.
Example:
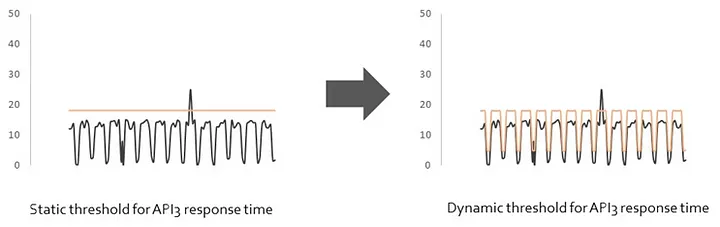
Following figure shows that the response time of API 3 demonstrates temporal patterns where the response if high on weekdays and low on weekends. Here, instead of a static threshold, a dynamic threshold is recommended showing higher thresholds on weekdays and lower thresholds on weekends.
Composite Thresholds
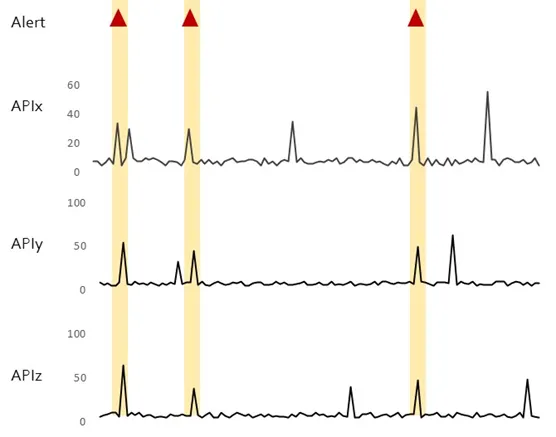
The thresholds discussed so far look at one metric in isolation. However, many real-world anomalies manifest when more than one metric start showing abnormal behaviour. For instance, consider an application that starts observing failures when heap, threadpool, connectionpool; they all start observing high utilization levels. Alerting of such scenarios can be made lot more effective by considering more than one metrics to generate an alert.

Classification and regression techniques provide effective solutions to analyse multiple metrics and identify the behaviour ranges of these metrics, which when collectively crossed, lead to an alert. These insights can be used to define a composite threshold that defines thresholds of multiple metrics. An alert is generated when all these metrics cross their normal behaviour thresholds.
Example:
Following figures shows an example of the response time of 3 APIs, and how an alert gets generated only then all 3 APIs demonstrate a high response time.
Self-tuning and Self-learning Thresholds
Enterprise IT systems undergo change on a continuous basis. These include business changes such as onboarding of new applications or change in business workload. These also include technology changes such as version upgrades or topology changes. It is important to accommodate these changes while computing thresholds to ensure that the thresholds are accurately representing the normal behaviour ranges.
Incorporating expert feedback also helps in making thresholds realistic and more applicable for real-world scenarios. User feedback helps to identify special business scenarios such as sales campaigns, promotional events, or housekeeping activities. It also helps to fine-tune the aggressiveness of the thresholds. For instance, the business-critical applications need thresholds where even minor deviations from normal behaviour requires alerting. On the other hand, machines in development or testing environments or housekeeping applications might prefer more relaxed thresholds for alerting. Such feedback from an SME can help further finetune the thresholds.
Conclusion
Normal behaviour characterisation is more than mere technical configurations; it is the backbone of effective anomaly detection and operational health management. It pins the problem of missing genuine anomalies or generating false alerts and helps generate just the right alerts at the right time. Consequently, it helps in reducing downtime, improving operational efficiency, and optimizing resource utilization. As organizations embrace smarter, adaptive threshold strategies, organisations can unlock the potential for proactive issue detection, enhanced resilience, and streamlined, noise-free operations. The result? A more agile, efficient business that stays ahead of challenges, drives productivity, and maintains seamless continuity.
