
Enterprise operations monitor various metrics associated with the stability, performance, availability, and other such aspects of business, application, and IT infrastructure. These could be business KPIs such as footfall, checkout time, and sales of the flagship stores. These could be performance metrics such as the response time of business-critical applications. These could be the queue length or enqueue rate of the backbone message queues. Various scenarios are prevalent in the real world where the operations teams look for the normal behavior of these metrics, keep an eye on trends and anomalies, and act on seeing any aberrations.
Existing monitoring dashboards allow configurations of metrics of interest and present their real-time view. However, the traditional approach to IT operations monitoring and anomaly detection has three key limitations:
- Siloed analysis: Metrics are viewed in isolation, requiring manual interpretation to connect the dots across multiple metrics and draw inferences.
- Primitive anomaly detection: Univariate statistical analysis often misses behavioral anomalies.
- Lack of predictability: Limited ability to predict metrics or business KPIs, especially when considering the impact of multiple variables on the business KPIs.
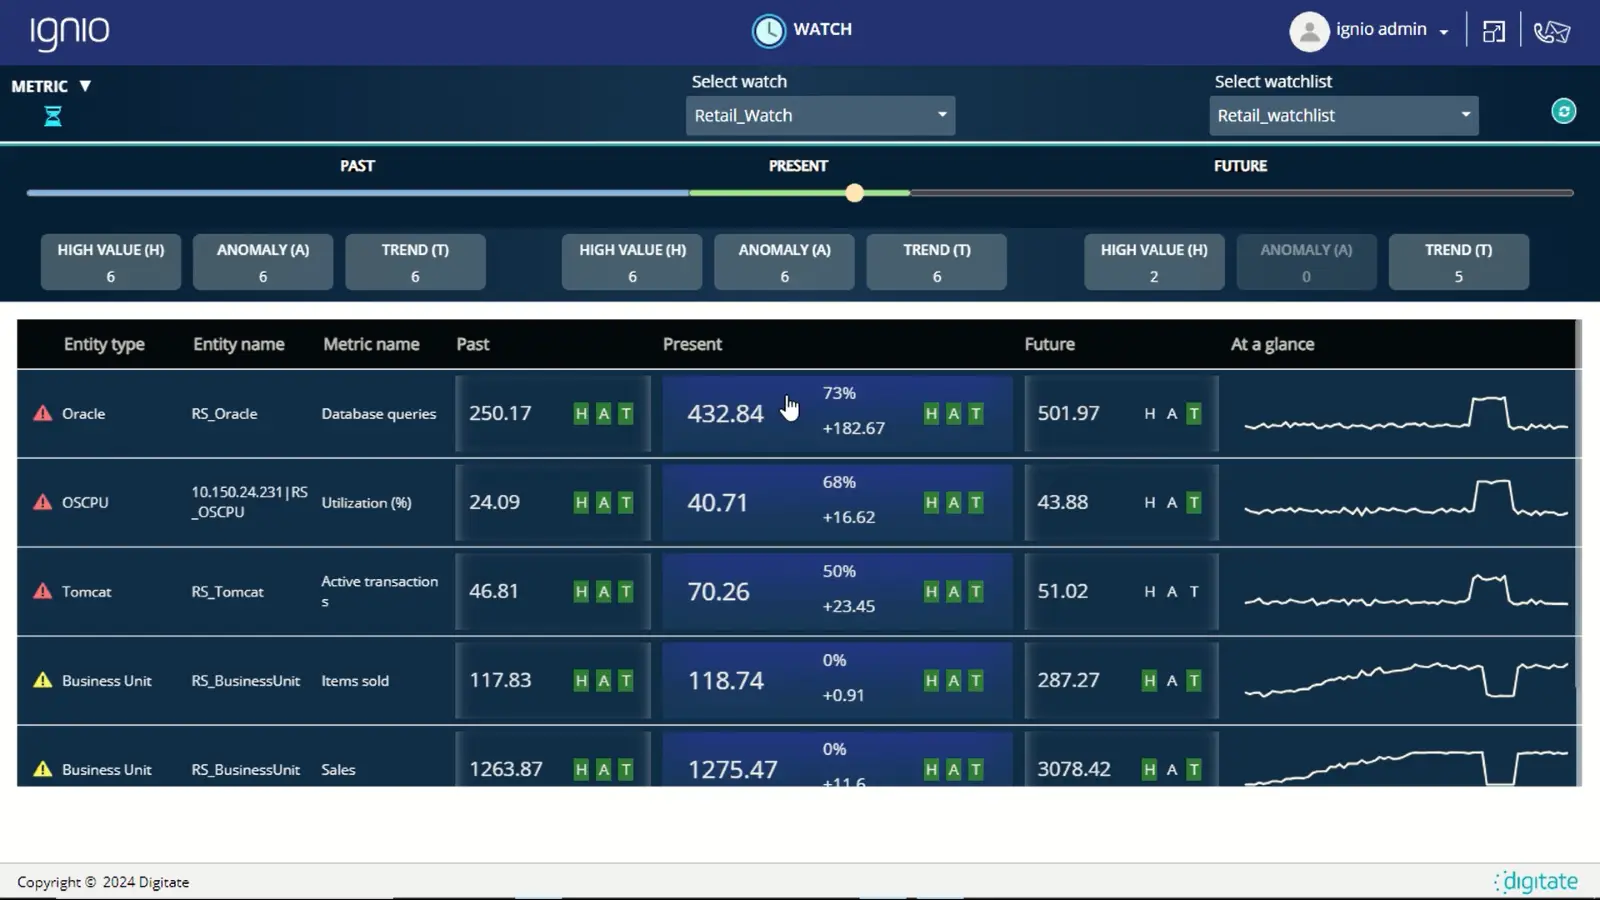
ignio’s Metric Watch addresses these limitations. Metric Watch is an AI-powered feature to view the past, present, and future of metrics/KPIs in real-time with the following key aspects:
- It detects metrics anomalies in real-time, using complex event processing
- It predicts metrics and business KPIs in real-time, using multi-variate predictions
- It provides an operations workbench to
- Identify metrics that need attention
- Diagnose incidents and anomalies
- Predict the impact of influencers on business KPIs

Design Rationale For IT Operational Monitoring With Metric Watch
Metric Watch is built on three key principles:
- Multi-variate behavioral models: Instead of looking at each metric in isolation, it is important to identify the influencing metrics and capture multi-variate behavioral models. For example, instead of analyzing application response time in isolation, a comprehensive analysis of application performance along with workload and infrastructure utilization leads to a better understanding.
- Complex event processing: Simplistic statistical analysis fails to capture many possible aberrations caused by a problem. This leads to inadequate problem signature and inaccurate diagnosis. It is important to perform complex event processing that detects a wide variety of anomalies ranging from simple-transient-univariate anomalies to complex-persistent-multi-variate anomalies. The following are examples of different types of anomalies detected by the Metric Watch:
- Point-in-time anomalies: These anomalies refer to transient abnormal behavior where the metric value shows a sudden peak or a dip at a point at a time. An application response time showing a temporary spike is an example of such an anomaly.
- Span-of-time anomalies: These anomalies refer to more persistent anomalies where a metric value stays in the out-of-normal range for a sustained period. An application showing a high response time for multiple transactions over a few minutes is an example of such an anomaly.
- Composite anomalies: These anomalies refer to scenarios where more than one metric shows abnormal behavior at the same time. Such anomalies usually point to more detailed problem signatures by showing all the symptoms caused by a fault. An instance of such an anomaly is where application response time, request count, heap utilization, thread pool utilization, and disk I/O all show anomalous behavior at the same time.
- Multi-variate anomalies: Many metrics have strong relationships with each other. Multi-variate anomalies capture cases where this inter-metric relationship does not behave as expected. For example, message queue length is a function of enqueue rate and queue processing time. Multi-variate anomalies will capture cases where the message queue length shows an increase even when the enqueue rate and queue processing time are not increasing.
- Real-time multi-variate prediction: Metric behavior is influenced by multiple factors. Incorporating these factors into real-time predictions significantly enhances accuracy. For example, the prediction of the checkout time at a store is a function of many aspects such as footfall, basket spending , and scanning time, among others. Adjusting the prediction based on these influencers can lead to more accurate forecasts. Similarly, the completion time of a business process is often a function of many metrics such as workload, file size, and available infrastructure capacity. Instead of predicting the process completion time based on past trends and patterns, adapting the predictions with any changes in workload or infrastructure optimizes prediction accuracy.

Enabling an operations workbench for IT monitoring
Metric Watch with its detailed view of the past, present, and future of various metrics can be a powerful tool for an operations workbench. It can be used to identify areas that need attention, carry out diagnosis, or prepare for the future. The following are some use cases:
Monitoring business-critical metrics and identifying areas that need attention
Metric Watch can be configured to highlight key metrics of interest. For each of these metrics, the Metric Watch shows the following information:
- It shows the real-time metrics.
- It illustrates how average values have changed from past to present and forecasts a representative future value.
- It detects different types of outliers in the past and present.
- It captures trends and presents a view of predictions with real-time updates.
Based on all these factors, the Metric Watch identifies metrics requiring attention and prioritizes them in the list. Thus, the Watch serves as a valuable dashboard for monitoring business-critical metrics.
Consider an example where the Watch monitors the sales of all regional stores. It can show a real-time view of all stores, highlighting anomalies for stores with very low sales, and showing trends with a dip in sales. The Watch will also point out the stores that need attention, based on these factors observed in the past, present, and future.
Some more examples include monitoring the length of critical Message Queues or response times of business-critical applications.
Diagnosing the cause of IT incidents
Metric Watch can be a useful tool to diagnose an incident. On observing an incident, operational personnel can visit the Metric Watch to view all the metrics that can potentially cause the incident. It can correlate these metrics to help derive the problem signature and the potential root cause .
Consider an example of an incident raised for high application response time. Metric Watch can be used as a workbench as follows:
- It compares the past and present behavior of the application response time.
- It detects anomalies and trends in the application response time.
- It automatically populates all the metrics that influence the application response time such as heap utilization, thread pool utilization, database response time, and disk I/O, among others.
- It detects anomalies in these influencer metrics.
- It helps narrow down root causes by identifying metric anomalies that show strong correlations with the anomalies in application response time.
- It allows the user to customize investigations by adding other metrics for further analysis.
In many scenarios, AIOps solutions are not able to triage an incident automatically due to insufficient situational knowledge about the incident. Metric Watch can prove to be a powerful tool in such scenarios by providing an operations workbench to easily investigate and diagnose the incident.

Predicting business KPIs with operations monitoring
Metric Watch serves as a workbench to predict business KPIs and monitor the impact of various metrics that can influence these KPIs. Metric Watch’s advanced prediction engine captures the relationships between different metrics and uses these models to perform predictions and adapt these predictions in real-time.
Consider an example of viewing the KPIs of a retail store and predicting the average shopping time at a store. Metric Watch can be used as a workbench as follows:
- It captures various metrics that can influence the average store shopping time, such as the number of customers, basket size, and check-out time.
- It shows the real-time view of these metrics.
- It uses multi-variate prediction models to assess the impact of any change in these metrics on the store’s shopping time.

Comparison with traditional IT operational monitoring tools
The following table presents a comparison of ignio’s Metric Watch with traditional operational monitoring tools.

ignio’s Metric Watch stands out over traditional monitoring tools in its ability to detect complex anomalies, identify metrics that need attention, perform multi-variate forecasts, and provide a workbench to diagnose incidents and predict business KPIs.
Conclusion
With an increasing focus on digitization and observability, a large volume of data is being collected to monitor different layers of business, application, and infrastructure. However, creative solutions are required to make the best use of this data to manage enterprise IT systems. Metric Watch is an attempt towards one such tool to monitor the past, present, and future of metrics in real-time, and provide an operations workbench to identify areas that need attention, diagnose incidents, and predict business KPIs.
