In the previous post, What is OpenTelemetry?, we went over the What, Why, and the How of OpenTelemetry. We also went over the telemetry data lifecycle (data generation à collection à storage à usage) and how telemetry data (MELT) could be put to use to troubleshoot a representative web application scenario.
In this post, we will focus on the usage aspect of telemetry data. We’ll assume that the mechanisms for data generation, collection, and storage are in place, and that an ‘Observability Backend’ exists where MELT (Metrics, Events, Logs, and Traces) data is brought together at a specific consistency. Many enterprises have multiple monitoring and observability products gathering vast amounts of data. However, the real question is, who is looking at this data? What techniques are being used to correlate it and suppress noise? What intelligence is being used to derive insights? And whether there is any autonomous capability to act on these insights in order to resolve, predict and prevent any issues or outages. In the absence of these techniques, merely having tons of data leads to the question, ‘So what?’.
In this post, we are going to cover how ignio acts as an ‘Observability front-end’, consumes this data and helps with data or event (signal) into an insight and then into a meaningful resolution/proactive action. And all of this happens at machine speed, without any (or minimal) human dependency.
Digitate’s ignio – An overview
ignio™ is an AI-powered enterprise platform developed by Digitate. It’s designed to enable autonomous IT operations and business process automation across complex enterprise environments. ignio combines AI, machine learning, GenAI, AI Agents and automation to deliver intelligent operations. ignio’s features and capabilities can be broadly divided into the three categories below:
1. Observability (What is happening?): Get real-time insight into system performance, application behavior, and business transactions across hybrid and multi-cloud environments. Unified Observability is discussed in detail later in this article. Like any Observability solution, MELT data plays a key role in enabling ignio to understand context and assess real-time health of the system.
2. AI Insights (Why is it happening?): The ignio platform has a repository of AI algorithms that enables intelligent predictions and actionable insights toward problem resolution.
3. Automation (How to fix it?): Automated remediation actions and workflows are pre-configured to respond to issues that are detected, and they can proactively close them before they negatively impact IT or business operations.
ignio as Observability Front-end, providing Unified Observability
At Digitate, Unified Observability is about ‘visibility’ and ‘control’ to deliver IT and business KPIs across modern enterprises. These enterprises are often a complex mix of hybrid, cloud-hosted, and cloud-native environments, spanning across multiple cloud providers and third-party services.
The primary objective is to identify and resolve IT issues before they impact business performance and to monitor business KPIs in near real-time using business dashboards that are linked to their underlying IT components. Unified Observability is a combination of the following three key mechanisms:
1. Vertical Observability
This is also popularly referred to as full-stack observability. This establishes in the context of a ‘business function’ (e.g., retail store or supply-chain) and links services and applications in that area to the underlying applications and infrastructure components.

Metrics, Logs, and Traces data are heavily leveraged in building full-stack observability for a business function. Additionally, ignio provides automated health checks to assess the health and availability of critical components within the stack. Following are some examples:
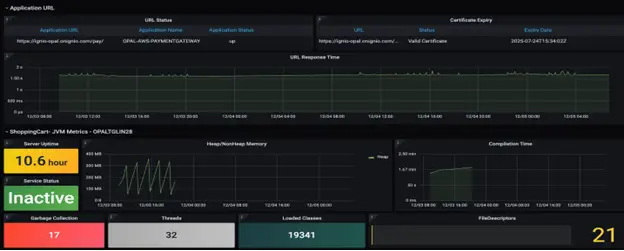


Bringing it all together, below is an example of how ignio represents the Vertical Observability for a business function. In the example below, it illustrates the health of one of the critical stores and the underlying business processes. It can be seen that one POS register is experiencing an issue in terms of high CPU utilization, impacting the Checkout process performance.
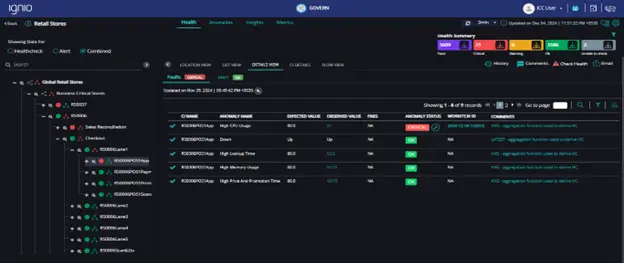
It’s worth noting that ignio does not stop at identifying an anomaly of higher CPU utilization for a POS register. It also provides an automated fix for the identified problem (shown as the icon). This is enabled through the in-built knowledge ignio possesses for prominent technologies (faults and fixes) and its ability to apply it with respect to the context it understands for a particular situation. This is a very critical aspect of the solution – demonstrating its ability to implement or offer ”Control” towards resolving the issue. ignio is fully configurable to implement such resolution actions autonomously, or with human-assisted approvals, or just limiting the recommended resolution to a human by means of notifications.
2. Horizontal Observability
A modern enterprise is a complex, dynamic eco-system that integrates people, processes, and technology to drive business outcomes. Multi-layered architectures, diverse technology stacks, data complexity, security, and compliance are some of the factors that drive up this complexity. Additionally, for cloud-native systems, including hybrid estates, containers, microservices and frequent deployments (CI-CD), it becomes really challenging to monitor business processes or business transaction flow.
Business transaction monitoring (BTM) enables end-to-end monitoring of business process flows and transactions to identify issues and anomalies across the hops.
For example, a purchase transaction in a retail store can involve the following hops:

The ability to keep track of critical business transactions in real time, across its hops, is essential. In the example above, the POS register and server can be hosted within a store. The payment gateway could be a third-party service, and the ERP system could be completely cloud-hosted. In such a hybrid environment, BTM brings in features that not only monitor the process end-to-end but also contextualizes transaction data to understand the impact on business operations. It can track technology and business KPIs for the end-to-end transaction and also at each hop of the flow:
POS register: Completion time
Store Server: Volume per unit time
Payment Gateway: Response time, Error rates
The diagram below illustrates the process of Sales Reconciliation and its end-to-end flow from the Store POS to the BI system. Just below the diagram, the dashboard shows the status of this process, including the number of transactions and their status (how many completed successfully, how many are in progress, long running, stuck, missing or failed). It also shows the problematic hop in the reconciliation process, which in this case appears to be the Integration Platform with anomalies specified in the table at the bottom of the screen.
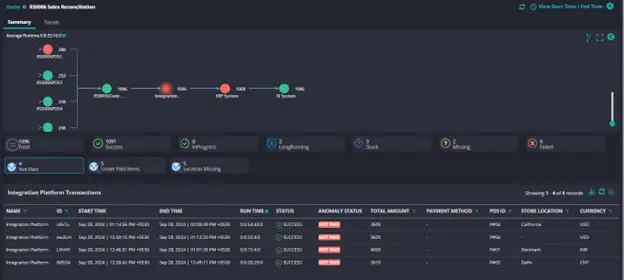
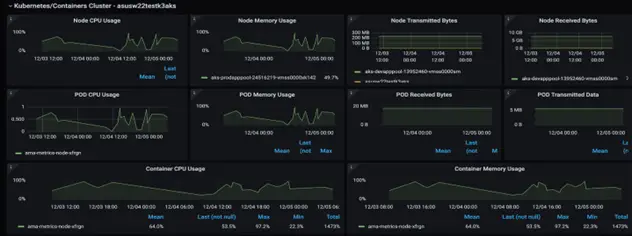
We can trace this down further to the underlying infrastructure and its behavior within the integration platform to determine if any of the anomalies are due to infrastructure level issues. This demonstrates how Vertical Observability (as explained in the previous section) is also leveraged.
3. Adaptive Observability
This is an advanced approach towards Observability where data is collected and analyzed based on the system’s current state, enterprise context, and goals. It goes beyond traditional observability by being context-driven, resource-efficient, and intelligent. Below are some of the key features of ignio that are based on the concept of Adaptive Observability:
a. Enterprise context and blueprint
The blueprint is ignio’s ability to provide a 360-degree view of the enterprise IT landscape. This blueprint is at the center of all lifecycle services of IT operations and forms the foundation of ignio functionalities:
- Topology and relationships of IT components
- Behavior insights, profiling and predictions
- Baselining, dynamic thresholds and noise-suppression
b. Proactive health checks
This is a key feature that enables systems to anticipate and prevent issues before they impact users or operations. These are intelligent, automated assessments of system components – app, services, and infra components detect problems before they occur.
- Pre-built health checks for major technologies and system components
- Continuous monitoring of system health – anomalies against the baseline
- Early detection of anomalies and automated remediation
c. Event and Incident Management
With a plethora of monitoring solutions available, enterprises often experience an alerts and events storm. It’s almost impossible to validate each one of these alerts and events manually.
ignio integrates with monitoring solutions deployed in the eco-system, uses the enterprise context and conducts rule-based, model-based and case-based correlation to suppress the alert noise and only convert legitimate alerts and events into incidents.
For incidents created through noise suppression (or other incidents registered in the ITSM solution), ignio retrieves the incident, establishes the correlation with the available context, performs causal analysis to identify the root-cause and then can also perform resolution actions. In case of inability to perform corrective actions, it assigns the workflow to a human with all the intelligence gathered throughout the process.
d. Cross-domain monitoring
ignio uses the following mechanisms to ensure maximum monitoring coverage across all systems within the scope:
Integrations
ignio comes with out-of-the-box integrations for all prominent monitoring solutions – ITSM, CMDB, IAM, PIM/PAM solutions and batch schedulers. It leverages these integrations to bring in relevant MELT data that enables it to build a solid context including relationships and behavior of key systems.
ignio’s ability to leverage native OpenTelemetry components (Collector and Otel Protocol) also comes under this category, in environments where OpenTelemetry is used to generate MLT data.
ignio Observe
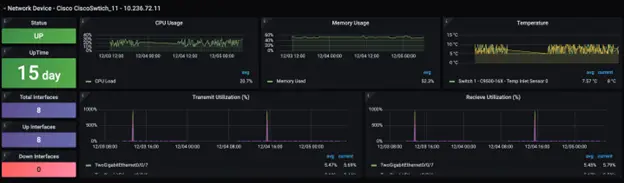
This is ignio’s native, agent-based solution for cross-stack monitoring. It uses Artificial Intelligence (AI) and Machine Learning (ML) algorithms to mine and prescribe actionable unique patterns from log files and monitor metrics from various technology stacks. It generates alerts and events, as well as predicts and suggests future events based on historical data. It comprises comprehensive dashboards that enable the observability of different systems, applications, networks, databases, and more. Observe also provides features on K8, network devices monitoring.
Data used by ignio
Data is the backbone of any AIOps (Artificial Intelligence for IT Operations) platform, and ignio is no exception. Data quality, volume, and diversity directly impact how effectively AIOps platforms can detect, diagnose, and resolve issues across enterprise IT environments. If AIOps is that high-powered, intelligent engine; then quality data is like the premium fuel that is needed to keep it running at its best. The table below indicates how ignio leverages a variety of data to build its understanding (context) of the eco-system and to provide Unified Observability.
Data | Typical Sources | Data Type | Usage in AIOps |
CI Config Details | CMDB, Service Maps | Structured | Context building |
Topology – Relationships between components | CMDB, Service Maps | Semi-structured | Context building |
Logs | System, App, Service, Security | Unstructured | Anomaly detection, Patterns, RCA |
Metrics | Systems, Monitoring solutions | Structured | Anomaly detection, Behavior patterns, Predictions |
Traces | App, Microservices, Monitoring/APM solutions | Unstructured | RCA, Diagnostics, Transaction mapping |
Alerts, Events | Monitoring solutions | Semi-structured | Correlation, Noise reduction, Incident creation |
Incidents, SRs, CRs | ITSM | Semi-structured | Autonomous remediation, Change impact analysis |
User-behavior | End-user devices, EUM solutions | Semi-structured | End-user experience |
Benefits
- Achieve Unified Observability by combining OpenTelemetry and ignio
- OpenTelemetry APIs, SDKs for telemetry data generation (instrumentation)
- Data transition to ignio using OTel native mechanisms – Collector, OTLP
- Visualization, intelligent insights and powerful analytics with ignio
- OpenTelemetry and ignio – One Intelligent Platform for:
- Unified Observability – Horizontal and Vertical Observability to connect the dots across business and underlying IT
- Intelligent Insights – ignio’s AI/ML backbone for prediction-based continuous improvement
- Closed-loop automation – Leverage ignio’s 10K plus, in-built knowledge components to perform closed-loop automation
- Unified and standard way of Telemetry Data Lifecycle
- OTel is open source
- Vendor-agnostic – You own the telemetry data you generate
- Data export is easy and can be coupled with any Observability back-end and front-end
- Opportunities for Tools Rationalization and Cost Optimization
- Reduce/Replace/consolidate multiple Monitoring solutions to generate Telemetry data
Combine OpenTelemetry with ignio for Unified Observability, AI-driven insights, and closed-loop automation. Simplify your telemetry data lifecycle while optimizing costs and tools. Want to learn more about how ignio can help you achieve that? Schedule a demo with us today.