Skip to content
Business Observability – Bridging the business and IT worldsREGISTER NOW
Reimagining IT Operations: The Role of AI Agents in Modern IT Teams WATCH NOW
ignioâ„¢ release - Digitate Unveils Industry's Most Comprehensive AI AgentsREAD MORE
Enterprise AI & Automation Software Solutions - Digitate
Main Menu
  • Products
      What we solve

      Digitate’s empowers organizations to transform their operations with intelligence, insights, and actions.​

      Platform Overview
      ignio Products

      AIOps

      Redefining IT operations with AI and automation

      • Observe
      • Cloud Visibility and Cost Optimization
      • Business Health Monitoring
      • IT Event Management

      Workload Management

      Enabling predictable, agile and silent batch operations in a closed-loop solution

      • Business SLA Prediction

      ERPOps

      End-to-end automation for incidents and service requests in SAP

      • IDoc Management for SAP

      Digital Workspace

      Autonomously detect, triage and remediate endpoint issues

      Cognitive Procurement

      AI-based analytics to improve Procure-to-Pay effectiveness

      Assurance

      Transform software testing and speed up software release cycles

  • Platform
      What we do

      Digitate helps enterprises improve the resilience and agility of their IT and business operations with our SaaS–based platform.

      Platform Overview
      Platform

      ignioâ„¢ Platform

      ignio™, Digitate’s SaaS-based platform for autonomous operations, combines observability and AIOps capabilities to solve operational challenges

      AI Agents

      ignio’s AI agents, with their ability to perceive, reason, act, and learn deliver measurable business value and transform IT operations.​

      • AI Agent for IT Event Management
      • AI Agent for Incident Resolution
      • AI Agent for Cloud Cost Optimization
      • AI Agent for Proactive Problem Management
      • AI Agent for Business SLA Predictions
  • Resources
      Looking for something?

      Discover how we empower customer success and explore our latest eBooks, white papers, blogs, and more.

      Blogs
      Podcasts
      Customers Success
      Omdia Research Report
      Resources

      Analyst Reports

      Discover what top industry analysts have to say about Digitate​

      ROI

      Get insights from the Forrester Total Economic Impactâ„¢ study on Digitate ignio

      Webinars & Events

      Explore our upcoming and recorded webinars & events

      Infographics

      Discover the capabilities of ignio™’s AI solutions

      Blogs

      Explore insights on intelligent automation from Digitate experts

      Trust Center

      Digitate policies on security, privacy, and licensing

      e-Books

      Digitate ignioâ„¢ eBooks provide insights into intelligent automation

      Podcasts

      Explore our upcoming and recorded podcast

      Case Studies

      Learn how businesses overcame key AI-driven automation issues

      Reference Guides

      Guides cover AIOps and SAP automation examples, use cases, criteria

      White Papers and POV

      A library of in-depth insights and actionable strategies

  • Company

      What we solve

      At Digitate, we’re committed to helping enterprise companies, realize autonomous operations.

      Integration
      Channel Partner
      Technology Partner
      Azure Marketplace
      Resources

      Leadership

      We’re committed to helping enterprise companies realize autonomous operations

      Academy

      Evolve your skills and get certified

      Newsroom

      Explore the latest news and information about Digitate

      Contact Us

      Get in touch or request a demo

      Partners

      Grow your business with our Elevate Partner Program

Request a Demo
Request a Demo
Enterprise AI & Automation Software Solutions - Digitate
BLOG

What is OpenTelemetry?

By Amit Shastri
  • Product Insights
🕒 10 min read
Table of Contents
Recent Blogs

IT as the Proving Ground for AI: Driving Enterprise Innovation

January 29, 2026

CloudOps Revolution: Redefining SaaS Operations

January 20, 2026

Accelerating IT Transformation with Agentic AI

December 15, 2025

AI Agent for Business SLA Predictions: Safeguarding Business Continuity with Predictive Intelligence

December 1, 2025

AI Agent for Proactive Problem Management: A Shift Toward a Ticketless Future

November 3, 2025

AI Agent for Cloud Cost Optimization: From Blind Spots to Smarter Spend

October 23, 2025

Governed by CNCF (Cloud Native Computing Foundation), OpenTelemetry (OTel), is an open-source Observability framework that helps understand the performance and health of on-premises, on-cloud, and cloud-native systems. It achieves this through:  

  • Telemetry data generation (instrumentation) 
  • Exporting this data to Observability solutions 

This framework is vendor and tool agnostic, which means that it can be used with a variety of Observability backends and frontends. There is no vendor (or tool) lock-in whatsoever. It’s important to understand that OpenTelemetry in itself is neither a backend nor a frontend for Telemetry data. 

Before we dive deeper into the ‘how’ of OpenTelemetry, let’s quickly go over the definitions of some critical terminologies and concepts: 

  • Monitoring: It’s a process of taking a point-in-time snapshot of system metrics and triggering alerts based on pre-defined thresholds. It’s often after-the-fact in nature. 
  • Observability: The ability to understand the system by examining its Telemetry data, without knowing its inner workings. It provides a holistic view of system behavior and helps to understand the ‘what’ and ‘why’ behind the issues. 
  • Telemetry data: This is often referred to as MELT data – Metrics, Events, Logs, and Traces (each one of these is explained in detail later in this document) 
  • Instrumentation: It’s a process of enabling the system to emit telemetry data.  
    • Code instrumentation is based on APIs and OpenTelemetry SDKs available for technology platforms and programming languages. 
    • Zero-code instrumentation is based on the environment the application runs in, and the libraries used. This is particularly useful when application code access is not available (or is limited). 

In this post, we will cover the following: 

  • The significance of OpenTelemetry 
  • Telemetry data lifecycle 
  • Telemetry data usage 
  • How does a multi-tier web application work? 
  • The ignio advantage 

The significance of OpenTelemetry 

The need for Observability is more than ever in today’s increasingly complex environments comprising Cloud computing, Microservices, and AI technologies. OTel aims to standardize the way Telemetry data is generated, transmitted, and processed, while being flexible to the already existing data streams. 

  • Telemetry data (MELT) is a primary building block of an effective Observability solution 
  • OTel not only enables Telemetry data generation and export, but is also: 
    • Easy: Single set of OpenTelemetry APIs, semantic conventions. 
    • Vendor-neutral: No vendor lock-in. You own the data you generate. 
    • Coverage: Covers a wide range of technology platforms and programming languages. 
    • Loosely coupled: Easy to change Observability solution without any impact on the existing data generation and export mechanism. 
    • Universal: Large and growing community – Users, ISVs, Adopters, Integrators. 
    • Open-source eco–system for Observability: Open-source solution providing inherent support for other open-source backend systems like Prometheus and Jaeger. 
    • Extensible: A new data source or instrumentation library can be custom-built, and so is custom distribution for some of its components (Collector, Exporter). 
  • It’s very important to clarify that OpenTelemetry is NOT: 
    • An Observability backend – It is NOT meant to store any data 
    • An Observability frontend – It does NOT provide data visualization and analytics capabilities 

Telemetry Data Lifecycle 

So far, we have learned that Telemetry data (MELT) is at the core of everything when we talk about Observability. Let’s take a quick view of what are the different stages of Telemetry data lifecycle, right from its creation to usage for an observable system. 


  • Generate: It all begins with the generation of Telemetry data, which provides insights into the system’s health and performance. This is achieved through a process known as ‘Instrumentation’. OpenTelemetry offers two ways to instrument your code: 
    • Code-based instrumentation 
      • OpenTelemetry code instrumentation supports many popular programming languages (Java, Java Script, C++, C#, .NET, Go, PHP, Python, Ruby, to name a few) 
      • Suitable where code access is available 
      • Provides better observability and developer experience 
      • Enables coherent traces, logs, and metrics 
    • Zero-code instrumentation 
      • Good for getting started or when you do not have access to the application code 
      • OpenTelemetry instrumentation works on the libraries used by your application code and/or the environment code runs in, to generate telemetry data 
      • Instrumentation library added as a dependency 
      • Less control over tracing and metrics 


Zero-code Instrumentation (Source:Opentelemetry.io)


Both instrumentation methods can be used simultaneously. 

  • Emit: Once telemetry data is generated, the next step is to have it sent to the end-point service OR to a Collector using OpenTelemetry Protocol (OTLP).  
  • OTel Collector: OpenTelemetry collector offers vendor-agnostic implementation of how to receive, process, and export telemetry data. It eliminates the need to run, operate, and maintain multiple agents/collectors. It is particularly useful with complex, large scale environments with multiple data sources and backends for Telemetry data. 
    • Collect: Receivers collect telemetry data from one or more sources. It can be PULL/PUSH based data collection 
    • Process: Data collected is transformed, as needed, as per the rules or settings defined for each processor and collected data type. This includes data filtering, dropping, renaming among many other operations 
    • Export: Exporters send data to one or more backends or destinations. These can be PULL/PUSH based and may support multiple data sources 

Using Collector in production environment is best practice. 

  • Observability backend and frontend: These do not need to be two different systems, and they fall entirely outside the purview of  OpenTelemetry. In fact, one of the advantages of using OpenTelemetry is the flexibility it provides in choosing and replacing vendor solutions for Observability backend and frontend without any impact to telemetry data generation and collection mechanism. 
    • Backend: This is where telemetry data is stored and maintained.  For most organizations, this data serves as ‘digital evidence’ for their systems and services behavior and so, is quite important from a compliance point of view. 
    • Frontend: This is where telemetry data is visualized in terms of live dashboards and reports. End-user queries are answered with data analytics, and intelligent insights are derived. 

Telemetry Data Usage 

To understand a system from outside, an application code must emit signals like logs, traces, and metrics. Each of these signals has a specific significance towards understanding the state of the system. 

Logs 

A log is a time-stamped message emitted by an application or service, or other components. It’s either structured (preferred) or unstructured with optional metadata.


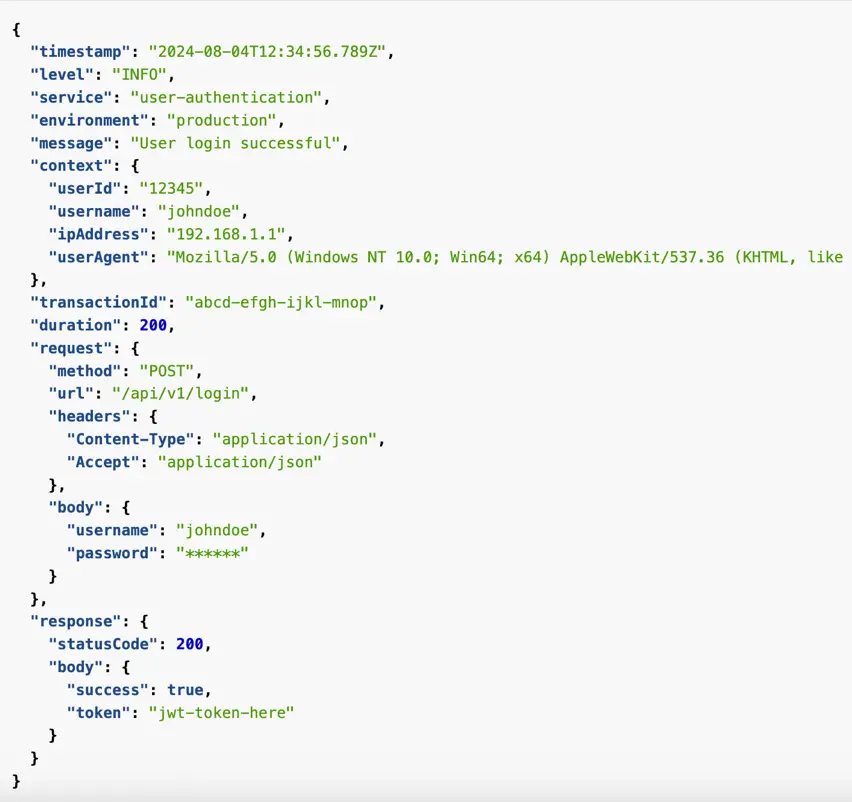
Unfortunately, logs aren’t extremely useful for tracking code execution, as they typically lack contextual information, such as where they were called from.  

Trace (Span) 

Unlike logs, a trace represents a unit of work or operation (for example, a business process like Order to Cash or a specific transaction like Checkout for eCommerce systems). It tracks specific operations that a request makes, painting a picture of what happened during the time in which that operation was executed.  

Spans are the building blocks of a trace.


Context propagation is the core concept that enables Distributed Tracing. With context propagation, spans can be correlated with each other and assembled into a trace, regardless of where they were generated.


Distributed Trace Example (Source:Opentelemetry.io)


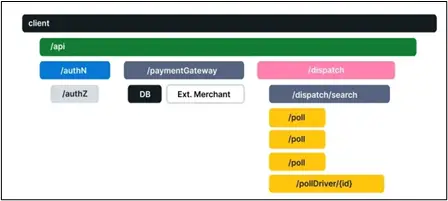
In complex systems, where a user transaction/request would flow through multiple hops (each one in itself being an application or service), distributed trace offers end-to-end visibility and details of what happened at each individual hop. 

A trace is made of one or more spans. It means more spans have the same trace ID. The first span represents the root span. Each root span represents a request from start to finish. The spans underneath the parent provide a more in-depth context of what occurs during a request. 

Metrics 

A metric is a measurement of a resource or service captured during runtime. It is always represented as a pair: the time instance at which the measurement was captured and the value of the measurement itself. 

Metrics are an important indicator of Performance and Availability. A trigger event can be raised when the metric value surpasses a certain pre-defined threshold. Metric is particularly important in understanding the behavioral pattern of a resource over a period of time and provides insights into its near-future performance. 

Bringing it all together – Troubleshooting scenario for a Web Application using Telemetry data 

Below is the representative sequence of steps that would help the operations team understand and resolve the issue using telemetry (MELT) data. 

  • An event is received stating that the application URL is not reachable –> The operations team understands there is something wrong with the application. 
  • The operations team tries to access the application and confirms the error reported. 
  • The operations team starts looking into the metrics data reported by two main components of this application (Tomcat server and Oracle DB server), including infrastructure level metrics. 
  • The operations team notices that the metrics representing Tomcat server stopped coming in at a specific time instance. However, Database and the underlying infrastructure metrics are being reported continuously –> This implies that the issue might be at the Tomcat server level. 
  • The operations team notices the timestamp at which the Tomcat server stopped reporting metrics. Then they start looking into the corresponding logs around that specific time instance. 
  • The team notices that there is ‘JVM OutOfMemoryError’ reported in the corresponding log file indicating that the JVM hosting Tomcat instance has exhausted the allocated memory. 
  • The operations team checks for the previous occurrences of this issue by checking previous log files. 
  • The operations team determines that the additional memory should be allocated to the JVM. They make the necessary changes and restart the Tomcat server. 
  • The application is now back up and the operations team confirms that all corresponding metrics are now getting reported. 

Please note that this was a rather simplistic scenario where the problem, its symptoms, and resolution were clearly identified through the Events, Metrics, and Logs data. In a real-world scenario, with way more increased complexity and volume, it becomes extremely difficult to manually keep track of: 

  • Incoming events and alerts 
  • Eyes-on-the-glass monitoring: Continuously looking at the MELT data received 
  • Assessing the legitimacy of incoming events (suppressing false-positives, duplicates and aggregation) 
  • Continuously running proactive health checks 
  • Knowing the context of each and every system (For example a web application running with Tomcat and Oracle DB. Has a history of frequent ‘JVMOutOfMemory’ errors) 
  • Identifying the symptom and root cause of the issue 
  • Resolving issues at machine speed to ascertain system availability and reliability 

And this is exactly where a good Observability backend and frontend solution are needed. Telemetry data is like digital evidence, and it must be persisted, which is a primary function of the Observability backend. The application type, criticality and any compliance requirements for a business domain also come into play while deciding persistence requirements. Once telemetry data is available, a good Observability front-end solution provides visualization, analytics and insights into the health of IT systems. Observability solutions empowered with AI/ML capabilities can not only ‘react’ towards a problem but can also predict and prevent an issue/outage. It would also be able to perform a resolution action using its GenAI and Automation capabilities. 

The ignio advantage 

This is where Digitate’s ignio™ comes into play. ignio is a SaaS-based platform that’s built on an agentic architecture. It delivers advanced intelligence and automation, minimizing the need for human intervention. Its AI/ML algorithms and automation engine not only provides ‘visibility’ based on telemetry data but can also enable ‘control’ to take corrective actions. 

In our next post, we will talk about how ignio enables Unified Observability for your enterprise IT, providing intelligent insights and the ability to perform actions for in-built automation. 

Digitate ignio
Author

Amit Shastri

CTO | Digitate

Get started with Digitate

Demo

Contact Us

Become a Partner

Contacts

Head Office

3975 Freedom Circle
10th Floor, Suite #1000
Santa Clara, CA 95054

X-twitter Linkedin Youtube Facebook Instagram
Company
  • About Digitate
  • Partner With Us
  • Newsroom
  • Blogs
  • Contact Us
Googke-Play-Store
Support
  • Data Privacy Policy
  • Website Use Terms
  • Cookie Policy Notice
  • Trust Center
  • Services and Support
  • Cookies Settings
  • California Notice At Collection
Apple-Store
Stay Connected
© Tata Consultancy Services Limited, 2025. All rights reserved
Products

What we solve

Digitate’s empowers organizations to transform their operations with intelligence, insights, and actions.​

Platform Overview
Products

ignio AIOps

Redefining IT operations with AI and automation

  • ignio Observe
  • Cloud Visibility and Cost Optimization
  • Business Health Monitoring
  • IT Event Management

ignio AI.Workload Management

Enabling predictable, Agile and Silent batch operations in a closed-loop solution

  • Business SLA Prediction

ignio AI.ERPOps

End-to-end automation for incidents and service requests in SAP

  • IDoc Management for SAP

ignio AI.Digital Workspace

Autonomously detect, triage and remediate endpoint issues

​ignio Cognitive Procurement

AI-based analytics to improve Procure-to-Pay effectiveness

ignio AI.Assurance

Transform software testing and speed up software release cycles

Platform

What we do

Digitate helps enterprises improve the resilience and agility of their IT and business operations with our SaaS–based platform.

Platform Overview
Platform

ignioâ„¢ Platform

ignio™, Digitate’s SaaS-based platform for autonomous operations, combines observability and AIOps capabilities to solve operational challenges

AI Agents

ignio’s AI agents, with their ability to perceive, reason, act, and learn deliver measurable business value and transform IT operations.​

  • AI Agent for IT Event Management
  • AI Agent for Incident Resolution
  • AI Agent for Cloud Cost Optimization
  • AI Agent for Proactive Problem Management
  • AI Agent for Business SLA Predictions

Resources

Looking for something?

Discover how we empower customer success and explore our latest eBooks, white papers, blogs, and more.

Blogs
Podcasts
Customers Success
Omdia Research Report
Resources

Analyst Reports

Discover what top industry analysts have to say about Digitate​

ROI

Get insights from the Forrester Total Economic Impactâ„¢ study on Digitate ignio

Webinars & Events

Explore our upcoming and recorded webinars & events

Infographics

Discover the capabilities of ignio™’s AI solutions

Blogs

Explore insights on intelligent automation from Digitate experts

Trust Center

Digitate policies on security, privacy, and licensing

e-Books

Digitate ignioâ„¢ eBooks provide insights into intelligent automation

Podcasts

Explore our upcoming and recorded podcast

Case Studies

Learn how businesses overcame key AI-driven automation issues

Reference Guides

Guides cover AIOps and SAP automation examples, use cases, criteria

White Papers and POV

A library of in-depth insights and actionable strategies

About Us

Who we are

At Digitate, we’re committed to helping enterprise companies, realize autonomous operations.

Integration
Channel Partner
Technology Partner
Azure Marketplace
Resources

Leadership

We’re committed to helping enterprise companies realize autonomous operations

Newsroom

Explore the latest news and information about Digitate

Partners

Grow your business with our Elevate Partner program

Academy

Evolve your skills and get certified

Contact Us

Get in touch or request a demo

Search
Request a Demo
Contact Us
Products

What we solve

Digitate’s empowers organizations to transform their operations with intelligence, insights, and actions.​

Platform Overview
Products

ignio AIOps

Redefining IT operations with AI and automation

  • ignio Observe
  • Cloud Visibility and Cost Optimization
  • Business Health Monitoring
  • IT Event Management

ignio AI.Workload Management

Enabling predictable, Agile and Silent batch operations in a closed-loop solution

  • Business SLA Prediction

ignio AI.ERPOps

End-to-end automation for incidents and service requests in SAP

  • IDoc Management for SAP

ignio AI.Digital Workspace

Autonomously detect, triage and remediate endpoint issues

​ignio Cognitive Procurement

AI-based analytics to improve Procure-to-Pay effectiveness

ignio AI.Assurance

Transform software testing and speed up software release cycles

Platform

What we do

Digitate helps enterprises improve the resilience and agility of their IT and business operations with our SaaS–based platform.

Platform Overview
Platform

ignioâ„¢ Platform

ignio™, Digitate’s SaaS-based platform for autonomous operations, combines observability and AIOps capabilities to solve operational challenges

AI Agents

ignio’s AI agents, with their ability to perceive, reason, act, and learn deliver measurable business value and transform IT operations.​

  • AI Agent for IT Event Management
  • AI Agent for Incident Resolution
  • AI Agent for Cloud Cost Optimization
  • AI Agent for Proactive Problem Management
  • AI Agent for Business SLA Predictions

Resources

Analyst Reports

Discover what the top industry analysts have to say about Digitate

Blogs

Explore Insights on Intelligent Automation from Digitate experts

ROI

Get Insights from the Forrester Total Economic Impactâ„¢ study on Digitate ignio

Case Studies

Learn how Digitate ignio helped transform the Walgreens Boots Alliance

Trust Center

Digitate policies on security, privacy, and licensing

e-Books

Digitate ignioâ„¢ eBooks Provide Insights into Intelligent Automation

Infographics

Discover the Capabilities of ignio™’s AI Solutions

Reference Guides

Guides cover AIOps and SAP automation examples, use cases, and selection criteria

White Papers and POV

Discover ignio White papers and Point of view library

Webinars & Events

Explore our upcoming and recorded webinars & events

About Us

Who we are

At Digitate, we’re committed to helping enterprise companies, realize autonomous operations.

Integration
Channel Partner
Technology Partner
Azure Marketplace
Resources

Leadership

We’re committed to helping enterprise companies realize autonomous operations

Newsroom

Explore the latest news and information about Digitate

Partners

Grow your business with our Elevate Partner program

Academy

Evolve your skills and get certified

Contact Us

Get in touch or request a demo

Request a Demo
Digitate - Autonomous Enterprise Software
Products

What we solve

Digitate’s empowers organizations to transform their operations with intelligence, insights, and actions.​

Platform Overview
Products

ignio AIOps

Redefining IT operations with AI and automation

  • ignio Observe
  • Cloud Visibility and Cost Optimization
  • Business Health Monitoring
  • IT Event Management

ignio AI.Workload Management

Enabling predictable, Agile and Silent batch operations in a closed-loop solution

  • Business SLA Prediction

ignio AI.ERPOps

End-to-end automation for incidents and service requests in SAP

  • IDoc Management for SAP

ignio AI.Digital Workspace

Autonomously detect, triage and remediate endpoint issues

​ignio Cognitive Procurement

AI-based analytics to improve Procure-to-Pay effectiveness

ignio AI.Assurance

Transform software testing and speed up software release cycles

Platform1

What we do

Digitate helps enterprises improve the resilience and agility of their IT and business operations with our SaaS–based platform.

Platform Overview
Platform

ignioâ„¢ Platform

ignio™, Digitate’s SaaS-based platform for autonomous operations, combines observability and AIOps capabilities to solve operational challenges

AI Agents

ignio’s AI agents, with their ability to perceive, reason, act, and learn deliver measurable business value and transform IT operations.​

  • AI Agent for IT Event Management
  • AI Agent for Incident Resolution
  • AI Agent for Cloud Cost Optimization
  • AI Agent for Proactive Problem Management
  • AI Agent for Business SLA Predictions

Resources

Analyst Reports

Discover what the top industry analysts have to say about Digitate

Blogs

Explore Insights on Intelligent Automation from Digitate experts

ROI

Get Insights from the Forrester Total Economic Impactâ„¢ study on Digitate ignio

Case Studies

Learn how Digitate ignio helped transform the Walgreens Boots Alliance

Trust Center

Digitate policies on security, privacy, and licensing

e-Books

Digitate ignioâ„¢ eBooks Provide Insights into Intelligent Automation

Infographics

Discover the Capabilities of ignio™’s AI Solutions

Reference Guides

Guides cover AIOps and SAP automation examples, use cases, and selection criteria

White Papers and POV

Discover ignio White papers and Point of view library

Webinars & Events

Explore our upcoming and recorded webinars & events

About Us

Who we are

At Digitate, we’re committed to helping enterprise companies, realize autonomous operations.

Integration
Channel Partner
Technology Partner
Azure Marketplace
Resources

Leadership

We’re committed to helping enterprise companies realize autonomous operations

Newsroom

Explore the latest news and information about Digitate

Partners

Grow your business with our Elevate Partner program

Academy

Evolve your skills and get certified

Contact Us

Get in touch or request a demo

Request a Demo