
We often come across the need to compare samples of two data sets to derive some conclusions about their similarity. Some common examples include assessing similarity of groups of users based on their purchase history, assessing similarity of servers based on resource utilization, or assessing similarity of applications based on their usage behaviour, among others.
But how does one measure similarity? Let’s find out!
To present the concepts, we will compare three pairs of data sets. These pairs are created such that one pair is very similar, another pair is partially similar, and the third pair is very dissimilar. Through these three pairs, you will see how to measure the similarity of such sets.
Data summary stats
One of the most common ways to measure similarity of two sets is to compare their data summary via mean and median. Figure 1 shows two graphs that compare the means and medians of the three pairs of data sets respectively. As we know, the three pairs have different levels of similarity but that is not exactly reflected in their mean or median values. Here, the data spread around their mean and median seems very similar. Using these graphs, you cannot separate the mean and median of the very similar pairs from the dissimilar pairs. By just looking at the graphs, you would observe that all the three pairs are very similar, but you know that is not the case! Thus, only measuring the similarity based on mean and/or median can be deceptive.

Figure 1: Mean and median of data sets.
Visualization tools
Another commonly used method to measure data similarity is using various visualization tools such as box plots, histograms, and cumulative distribution functions (CDFs).
- Box plots provide a graphical representation of the data by rendering minimum, first quartile, median, third quartile and maximum values. Figures 2 compares the box plot of the three pairs of data sets. Unlike the mean or median, the box plots provide a much more informed view of the data dissimilarities.
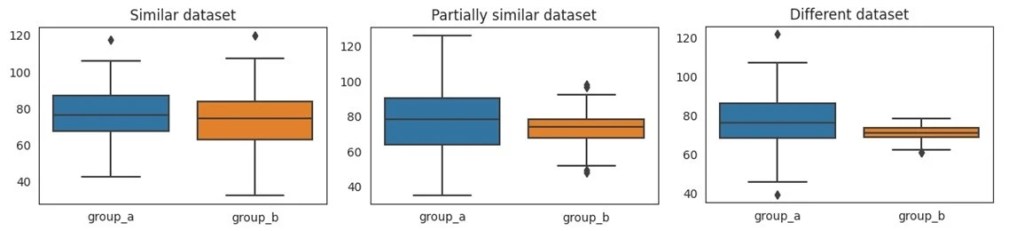
Figure 2: Box plots of data sets
- Histograms are another way to provide graphical representation of data. Figure 3 shows the histogram plots of the three pairs of data in our example. Here, the x– axis represents bins of logical ranges or bins of data. The y-axis represents the count of occurrences present in the data for each bin.

Figure 3: Histograms of data sets
- A cumulative distribution plot presents a graphical representation to understand how the values in the group are distributed. Figure 4 shows the cumulative distribution plots of the three pairs. Here, the x-axis shows the values of the variable. For each value on the x-axis, the corresponding value on the y-axis shows the proportion of variable values that are less than or equal to x.

Figure 4: Cumulative distribution plot of data sets.
Statistical significance tests
While visualization tools are a very expressive way to understand the data, they seldom can be scaled to large data sets. Given hundreds of data sets, comparing them by visualizing charts is an impractical approach. Hence, there is an imperative need to have some mathematical formulations to measure the similarity of data sets. Also, note that in many scenarios the data of the entire population is either unknown or difficult to obtain. In such cases, one needs to work with a sample of the population. This is where statistical significance tests can help.
Student’s t-test
One of the popular statistical significance tests is the Student’s t-test. An independent two-sample t-test is used to compare the means of two independent groups. The t-value is computed as follows:

This equation looks complicated, but it has a very simple explanation. It captures the signal to noise ratio. The numerator represents the signal, i.e., the difference in mean of two sets. The denominator represents the noise, i.e., total variance of the two groups. In other words, the denominator represents how scattered the data population is to trust the difference in the means. Heavily scattered data population indicates high noise. A high t-value indicates high signal and low noise. Similarly, a t-value closer to 0 indicates that the data sets are very similar without having a significant difference.
The t-value is often computed on a sample of the actual population. When you compute the t-value on another random sample of the same population, the t-value is likely to be a bit different. If you compute the t-value on thousands of such samples, you will end up with thousands of such t-values. Now, the question arises about which t-value to use and how large should the t-value of any random sample be to trust that the two populations are different. This is where p-value comes to help.
For a given pair of data-samples, Student’s t-test computes the t-value and a p-value. The t-value assesses the difference in the mean of two samples. The p-value provides the probability of getting a t-value at extreme ends in any random sample. In other words, t-value measures how different two samples are by measuring signal to noise ratio. The p-value measures how often we could observe such a signal to noise ratio.
Figure 5 compares the t-value and p-value of the three pairs of the data sets.
| Similar Groups | Partially Similar Groups | Different Groups |
t-value | 1.60 | 1.91 | 4.00 |
p-value | 0.10 | 0.06 | 0.00008 |
Figure 5: The t-value and p-value for three pairs of data sets.
Different types of t-test
There are different variations of the Student’s t-test. For simplicity, we limited the discussion above to the independent two-sample t-test. Here are three different variations of this test:
- Paired sample t-test: This test is used when the two sets are coming from the same population, e.g., compare the CPU utilization of Windows servers before and after a patch upgrade.
- Independent two-sample t-test: This test is used when the two sets are coming from two different population, e.g., compare the CPU utilization of Linux and Windows servers.
- One-sample t-test: This test is used when a set is compared against some standard value, e.g., compare the CPU utilization of Window servers with the standard acceptable limit of 80%
The example presented in Figure 5 refers to the independent two-sample t-test. This test works under the assumption that there is no relationship between the two groups, the data in each group is approximately normally distributed and the two groups are obtained via random sampling from the population.
Hypothesis testing
Statistical significance tests belong to the wider class of tests called hypothesis testing. Hypothesis testing is a statistical method used to determine if a certain hypothesis is true or not based on the available sample data.
- First, state your null and alternate hypotheses. The null hypothesis assumes that there is no significant difference between the two samples that are being compared. The alternate hypothesis believes that there is a significant difference.
- Next, use an appropriate statistical significance test to determine the test statistic score.
- With the help of the test score, determine a probability score associated with the results obtained under the null hypothesis, known as the p-value. The p-values indicates how likely it is that similarity will occur by chance and not because of any significant cause.
- Set a significance threshold (alpha), which will act like a threshold for the p-value. If the p-value is greater than alpha, then we do not reject the null hypothesis and assume that there is no significant difference between the two samples.
Other commonly used statistical significance tests
- Z-test:
- The Z-test is similar to the Student’s t-test that helps to compare means of two groups.
- It is used when we have large observations.
- Chi-squared test:
- The Chi-squared test is kind of statistical hypothesis test that is used to compare observed results with expected results.
- The Chi-squared test is ideally used when we want to compare categorical data. Examples of categorical data include gender, education qualification, occupation, etc.
- Anova test:
- The Anova test is also known as analysis of variance. It is helpful for testing three or more variables.
- Similar to multiple two-sample t-test, an Anova test allows you to compare more than two groups at the same time to determine the relationship between them.
- KS test:
- The KS test is used to detect more complex patterns compared – to the t-test, because the t-test and many other classical statistical tests has limitations like normality in data, which means the data must form a bell curve when plotted.
Conclusion
In this blog we explored how to define similarity between two groups. We often face such scenarios even in our day-to-day lives. For example, in clinical trials you can use these tests to determine similarities between different medicines. These tests can also be used in businesses to determine whether a new marketing campaign increased sales or not.
Statistical significance tests or hypothesis testing are some of the most important topics in statistics that are widely used in real-world scenarios and across many sectors such as finance, industries, healthcare, research, and economics. They are even used to determine the strength of the predictions of machine learning algorithms. Thus, statistical significance tests have a very significant usage in real life.
