Skip to content
IDC MarketScape · Worldwide AIOps 2026 - Digitate Named a Leader in AIOpsDOWNLOAD NOW
Webinar: ACI worldwide showing operational resilience for digital paymentsWATCH NOW
Reimagining IT Operations: The Role of AI Agents in Modern IT Teams WATCH NOW
Enterprise AI & Automation Software Solutions - Digitate
Main Menu
  • Products
      ignio Products
      network_intel_node
      AIOps
      Observe & resolve
      IT Event Management
      Resolve events & incident management at scale
      Cloud Cost Optimization
      Reduce cloud spend with intelligent analysis
      Business Health Monitoring
      Real-time business KPI tracking & alerting
      Observe
      Full-stack observability & anomaly detection
      avg_pace ️
      Workload Management
      SLA predictions
      Business SLA Prediction
      Predict and prevent SLA breaches proactively
      settings ️
      ERPOps
      SAP integration
      IDoc Management for SAP
      Automate SAP IDoc error resolution end-to-end
      devices ️
      Digital Workspace
      Employee ops
      Platform
      ignio™ Platform
      SaaS-based autonomous operations platform combining observability and AIOps to solve enterprise challenges.
      Platform Overview →
      AI Agents
      auto_awesome
      AI Agents
      ignio AI Agents for autonomous enterprise
      AI Agent for IT Event Management
      AI Agent for Incident Resolution
      AI Agent for Cloud Cost Optimization
      AI Agent for Proactive Problem Management
      AI Agent for Business SLA Predictions
      IDC MarketScape 2026

      Digitate Named a Leader in AIOps — Worldwide

      🏆
      An IDC MarketScape Leader Worldwide 2026

      Discover why IDC recognized Digitate as a Leader in AIOps. Get the full analyst report and see how ignio™ delivers unified observability & autonomous operations.

      Download Report →
  • Industries
      Industries
      account_balance
      BFSI
      BFSI AI Operations
      shopping_bag_speed ️
      Retail
      Supply chain intelligence
      travel
      Travel & Hospitality
      Enhance travel and hospitality
      health_metrics
      Healthcare & Life Sciences
      Intelligent health ops
      grocery
      Consumer Packaged Goods
      Drive smarter CPG value chains
      manufacturing
      Manufacturing
      Quality and compliance management

      Digitate Named a G2 Leader in Enterprise Grid® Report for AIOps Platforms

  • Resources
      Resources
      analytics
      Analyst Reports
      Discover top industry analysts report
      live_tv
      Webinars & Events
      On-demand sessions
      podcasts
      Podcasts
      Explore our upcoming and recorded podcast
      finance
      ROI
      Forrester Total Economic Impact™ study
      donut_small
      Infographics
      Discover the capabilities of ignio™’s AI solutions
      rss_feed
      Blogs
      Insights & thought leadership
      file_copy
      Case Studies
      Customer success stories
      article
      White Papers and POV
      Research & analysis
      book_2
      e-Books
      eBooks provide insights into intelligent automation
      menu_book ️
      Reference Guides
      Guides cover AIOps and SAP automation

      Agentic AI and the Future of Enterprise IT

      Explore more
  • Support
      Support & Services
      support_agent
      Services and Support
      Discover Digitate Service
      menu_book ️
      Documentation
      Product & developer guides
      diversity_2
      Community
      Connect, Share, & Exchange
      request_quote
      Pricing
      ignio capability based pricing
      security ️
      Trust Center
      Digitate policies on security, privacy, and licensing
      Agreements
      Global Compliance
      Security and Privacy

      Digitate Delivers Unmatched Value By Streamlining ITOps

      Explore more
  • Company
      Company
      globe_asia
      Leadership
      Our story & meet the executive team
      newspaper
      Newsroom & Press
      Announcements & media
      school
      Academy
      Evolve your skills and get certified
      contact_mail
      Contact Us
      Get in touch or request a demo
      handshake ️
      Partners
      Alliances & ecosystem
      Channel Partner
      Technology Partner
      Integration
      Marketplace

      Digitate Recognized as Solutions Partner from Microsoft

      Explore more
Request a Demo
Request a Demo
Enterprise AI & Automation Software Solutions - Digitate
article Blog

Data visualization – A Picture Indeed Speaks a Thousand Words!

By Surabhi Gore
  • AI/GenAI
🕒 12 min read

They say — “a picture is worth a thousand words”. And how rightly so! Complex and sometimes multiple complex ideas can be conveyed easily and effectively with a single image. The world of data analytics is no different. In today’s age of information overload, data visualization stands strong to bridge the gap between data-driven insights and human inference and adoption.

Data visualization is broadly used for 3 main objectives — to explore, to monitor, and to explain.

  • To explore: It helps users to understand their data better, interact with it, and find patterns and relationships.
  • To monitor: It is used to monitor data in real time and look for indicators of areas that need attention.
  • To explain: It is used to bring “explainability” to analytics. It provides an effective tool to explain, “why the analytics is saying, what it is saying”.

With increasing focus on observability and AI-powered insights, data visualization has now become an important step in the data science process. Visualization has penetrated deep in our day-to-day routine such that it is almost impossible to imagine these activities without their visual spectacle. Google Maps, with its great geographic visualization, has become our go-to application for everyday commute. Netflix has created an engaging personalized system of engagement for our everyday entertainment. Amazon has conquered most of e-commerce with effective visualization of various categories of items like groceries, shoes, and name any. They work on simple formulas of giving user a simple user interface and most of the job is done only through search. That really makes the application a go-to app.

Data visualization is a creative space. When it comes to visualizing data and data-driven insights, there is no single right answer. But each new visualization experience teaches some cool lessons. Below I present some of my experiences from this data visualization journey.


Good data visualization can often substitute for complex algorithms

Data visualization plays an essential role in making analysts familiar with data and its features. It can help understand data distribution, data quality, and even insights such as trends, patterns, outliers, clusters, among others. Data visualization can be so powerful that a well-rendered chart might derive insights without even the need for sophisticated algorithms!

Consider a case of analyzing the data of transaction spends. Such data contains a record of transactions where each transaction is associated with quantity, price, vendor, buyer, item, location, date of purchase, and other attributes.

Figure 1: Visualization of transaction spend

Figure 1(a) shows a scatter plot on the axes of quantity and price. Each bubble in this plot represents a transaction and its location in the plot shows its price and quantity. This rendering itself starts showing 4 clusters of transactions. Cluster A represents transactions with low quantity high price, and Cluster B represents transactions with bulk purchase with high quantity and low price. Both these clusters represent a normal behavior representing the phenomenon that prices are high for small-quantity purchases and low for bulk purchases. But Cluster C represents anomalous transactions showing high spends yet high prices. This insight did not require any algorithm for clustering or anomaly detection. A visualization was enough to make this inference.

Next, let’s add some more elements to this visualization. Figure 1(a) plots each transaction with a same size bubble. Figure 1(b) plots this data such that the size of bubble is based on the dollar value of that transaction. This visualization completely changes the focus. Cluster C was looking at a small cluster due to a small number of transactions. However, this same cluster, now becomes a lot more relevant because of its associated dollar value.

Let’s take this visualization one level deeper. Figure 1(a) and Figure 1(b) presents each transaction with the same color. Figure 1(c) color codes each bubble based on the vendor associated with the transaction and reveals some interesting insights. It shows that almost all of the transactions in the anomalous cluster, Cluster C, are associated with only two vendors. This gives a concrete lead for further investigation into the transaction anomalies. This insight which otherwise would need a classification algorithm is derived just by creative rendering of the data.

Note that, algorithms are surely required to derive insights on a large scale of data. However, intelligent visualization itself can be a very powerful tool to uncover many insights during the early data exploration.

So far, we demonstrated that effective visualization could derive insights without needing complex algorithms. Furthermore, visualization may be able to detect insights which otherwise may go unnoticed by an algorithm, such as unusual data distributions, local patterns, implicit patterns, etc.

Let’s look at one more example. The chart in Figure 2 explains the revenue distribution across years for a list of different music formats such as CDs, album downloads, cassette, etc. It is very hard to determine about the trend in music formats by looking at the raw data. But it is evident from a basic column chart how across the years trends vary. Look how the revenue from cassettes was at its peak during the 90’s and witnessed a drastic decline with emerging trends of CDs and DVDs. (in the second image).
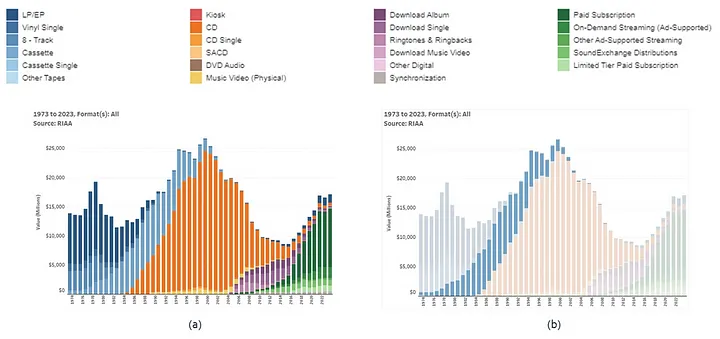
 

Figure 2: Recorded music revenues by format
Figure 2: Recorded music revenues by format (Source : https://www.riaa.com/u-s-sales-database/)

When it comes to data exploration, a good data visualization can do wonders. We just need to select the right data, narrow down the right scope, and pick the best metaphor of visualization and voila!


Data visualization makes AI-driven insights explainable

Well surely, we do need AI/ML models to bring out complex insights from the data. However, when using AI for business-critical decisions, users need some way to understand why the AI is saying what it is saying. Without that explainability, users are not able to build trust in the underlying AI engine, which has a direct consequence on the AI adoption. Explainability brings another significant benefit. As users start understanding the rationale behind AI-driven insights, they are able to validate and even augment those decisions with their intuition built over years of experience. Note that a business user might not need explanation of each and every parameter or each step of an algorithm. They most often focus only on the justification behind the decision made by an AI system.

Humans, in general, can process visual information much faster and much easier as compared to textual information. Same holds true for data-driven insights. Visual aids make for a great tool to explain algorithm output. Here are some examples:

  • Trees make for one of the best representations to explain the reasoning based on classification. Figure 3(a) shows a simple decision tree explaining the root-cause analysis of high response time. It shows that the response time is observed to be high only when the thread pool utilization is high, and the active process count is also high.
  • Scatter plots make it easy to explain regression equations capturing linear or non-linear relationships between 2 variables. Figure 3(b) shows how response time of an application is changing with increase in CPU utilization. It shows that for small values of CPU utilization, the response time increases gradually with CPU utilization. But as the response time increases exponentially, CPU utilization observes higher values.
  • Creative line-charts make it easy to understand time-series forecasting. Figure 3(c) shows the CPU utilization of a server in the form of a line-chart. It shows its past behavior and intuitively explains change points in the past behavior. It also shows increasing trend and a day of week pattern in the recent past, and how that intuitively leads to forecast and a potential CPU saturation in near future.
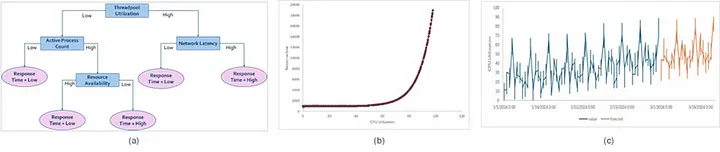
Figure 3: (a) Classification using trees, (b) Regression using scatter plots, (c) Forecasting using line-charts

Visual tools provide an effective medium to explain the workings of many deep learning algorithms.

  • Figure 4(a) shows how feature maps help visualize the evolution of an image through several iterations of a neural network.
  • Figure 4(b) shows how an image evolves over several iterations of a GAN.
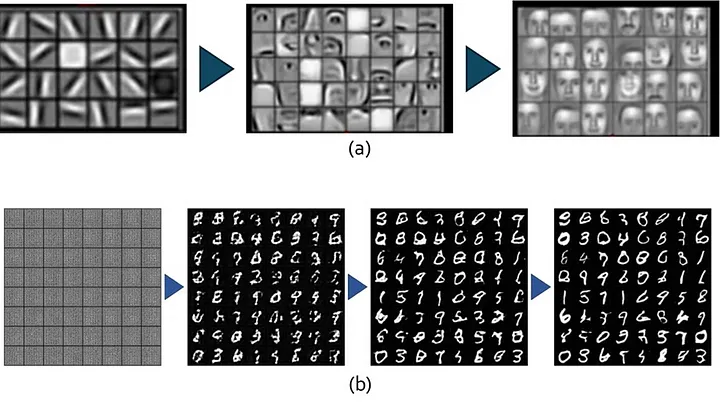
Figure 4: (a) feature maps — Source: https://towardsdatascience.com/, (b) image evolution through GANs — Source: https://medium.com/@igniobydigitate/gans-a-creative-adversarial-relationship-bc791f5f8225

In addition to the individual building block algorithms, visualization simplifies the explanation of even more complex product features that are built through a pipeline of several algorithms. Predicting a business process is one such example which includes algorithms such as regression, pattern mining, forecasting, anomaly detection, and fault impact propagation. An enhanced Gantt chart forms a very effective metaphor here.

Figure 5 shows the prediction of chain of business processes executions. It represents the interdependencies between the tasks through a Gantt chart. It embellishes the Gantt bars with colors, labels, and icons. It shows that Process 1 finished on time and met its deadline. Process 2 observed a failure in the first task which is likely to lead to an hour’s delay in its completion. Process 3, on the other hand, seems on track and is predicted to finish on time.

This visualization shows the inter-process dependencies, predicted behavior, anomalies, impact of anomaly, and the outcome on timely completion or delays in process executions.

Figure 5: Visualization of business process execution

Data visualization effectively tells a story with the data

Traditionally data analysis is often associated with spreadsheets, algorithms, equations, and models! However, these skills need to be complemented with “soft skills” to present the analysis in compelling manner. Data storytelling provides this skill to effectively communicate data-driven insights using well-defined personas, use case-centric narratives, and visualizations.

Data storytelling is like human storytelling but with added aspect of data-driven deep insights and visual evidence. It is now changing how we consume data and analytics.

Persona-driven narrative

Different users look at the data and insights from different perspectives. Hence, the data and insights need to be presented with a contextual narrative.

Consider an example of Uber here.

  • Figure 6(a) is a visual that most of us are familiar with as an Uber rider. It focusses on showing all the information that a rider is interested in after booking a cab ride, such as, where is the cab? What time will it arrive? How long will it take to reach the destination? etc.
  • Figure 6(b) shows a different visual of Uber rides. This visual is designed for the persona of an operations manager who is analyzing the usage of Uber rides to better manage and plan the entire ecosystem. It is the same data– what rides were taken, from and to locations of these rides, time taken by these rides, etc. This data is collected across multiple rides and is now presented using very different metaphors. The geographical maps overlayed with column charts help analysts in deriving insights such as the peak hours, high demand spots, bottlenecks, etc.
Figure 6: (a) Customer view — Source: https://www.google.com/, (b) Operations view — Source https://eng.uber.com/keplergl/

Connecting the dots

With increasing focus on observability, a wide variety of data is being collected, and equally, wide variety of insights are also being generated. However, the impact of these insights increases manyfold when we can connect the dots across these silos of observations and create a system of engagement.

Google maps (Figure 7) forms a great example to emphasize these points. It not just helps navigate from A to B, but also connects the dots across a variety of related information to offer a one-stop-destination to plan your ride. It shows information about places or things to do nearby. From the same experience, a user can book a hotel room, or restaurant table, view photographs, read user reviews, and so on. The net result is so much more effective than a humble geographical map.

Figure 7: Google Maps search — Source: https://www.google.com/maps

Addressing insight fatigue

Increasing focus on data analytics is leading to a side effect of insight fatigue. The AI engines are now generating so many diverse and complex insights that the end users are getting overwhelmed in consuming these to drive business decisions. Data storytelling’s objective is also to eliminate this insight fatigue by presenting the insights in the form of compelling story.

Consider an example of Paytm Money as shown in Figure 8. It distills the insights to give recommendations on stocks or funds based on categorical divisions such as — top gainers or losers, yearly high and lows, equity funds, hybrid funds, etc. The representation is simplistic in the form of grids or tables. However, it is made intuitive with the use of color coding, icons, and line charts, such that the users are able to easily make their selections from the list of recommendations.
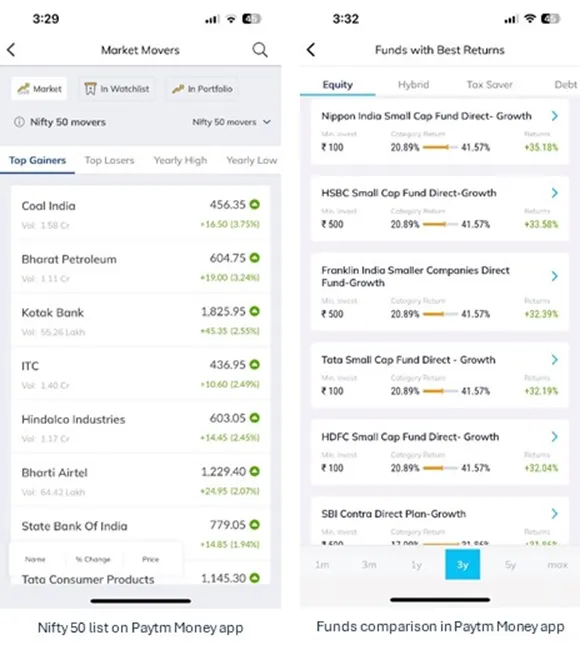
Figure 8: Paytm Money visualization

Closing notes

Data visualization is an exciting space, and it is getting increasing importance with the increasing penetration of data-driven insights into the business-critical activities. This blog is the first in a series of data visualization blogs that will cover various aspects such as how to go about visualization, what are the key elements of data visualization, what are the ongoing trends, and the science behind data visualization. Stay tuned!

Author

Surabhi Gore

User Experience Lead | Digitate

LinkedIn

Recent Blogs

How Pharma IT Teams Can Achieve Continuous GxP Compliance and Audit Readiness

July 28, 2026

Autonomous IT for Travel and Hospitality: Revolutionizing Guest Experiences and Operational Resilience

July 21, 2026

Why Modern Enterprises Still Get Blindsided And How Business Process Observability Changes That

May 31, 2026

Why Autonomous IT Is Becoming Essential for the Modern Industry

May 28, 2026

Autonomous IT for Life Sciences: From Downtime to Compliance-Ready Resilience

May 19, 2026

Digitate is Positioned as a Leader in the IDC MarketScape: Worldwide AIOps 2026 Vendor Assessment

April 28, 2026

Get started with Digitate

See ignio in action, talk to our team, or explore how partners grow with Digitate’s Elevate program.
play_circle Request a Demo mail Contact Us handshake Become a Partner

Stay in the loop

Get the latest on AI automation, product updates & industry insights.
Products
  • ignio™ Platform
  • AI Agents
  • AIOps
  • Workload Management
  • ERPOps
  • Digital Workspace
Resources
  • Analyst Reports
  • Blogs
  • Case Studies
  • Podcasts
  • Webinars & Events
  • e-Books
  • White Papers and POV
  • Infographics
Services and Support
  • Service and Support
  • Pricing
  • Documentation
  • Community
  • Trust Center
  • Data Privacy Policy
  • Website Use Terms
  • Cookie Policy Notice
  • Cookies Settings
  • California Notice At Collection
Company
  • About Digitate
  • Partner With Us
  • Newsroom
  • Academy
  • Contact Us
© Tata Consultancy Services Limited, 2025. All rights reserved
Products

ignio Products
network_intel_node
AIOps
Observe & resolve
IT Event Management
Resolve events & incident management at scale
Cloud Cost Optimization
Reduce cloud spend with intelligent analysis
Business Health Monitoring
Real-time business KPI tracking & alerting
Observe
Full-stack observability & anomaly detection
avg_pace ️
Workload Management
SLA predictions
Business SLA Prediction
Predict and prevent SLA breaches proactively
settings ️
ERPOps
SAP integration
IDoc Management for SAP
Automate SAP IDoc error resolution end-to-end
devices ️
Digital Workspace
Employee ops
Platform
ignio™ Platform
SaaS-based autonomous operations platform combining observability and AIOps to solve enterprise challenges.
Platform Overview →
AI Agents
auto_awesome
AI Agents
ignio AI Agents for autonomous enterprise
AI Agent for IT Event Management
AI Agent for Incident Resolution
AI Agent for Cloud Cost Optimization
AI Agent for Proactive Problem Management
AI Agent for Business SLA Predictions
IDC MarketScape 2026

Digitate Named a Leader in AIOps — Worldwide

🏆
An IDC MarketScape Leader Worldwide 2026

Discover why IDC recognized Digitate as a Leader in AIOps. Get the full analyst report and see how ignio™ delivers unified observability & autonomous operations.

Download Report →

Industries

Industries
account_balance
BFSI
BFSI AI Operations
shopping_bag_speed ️
Retail
Supply chain intelligence
travel
Travel & Hospitality
Enhance travel and hospitality
health_metrics
Healthcare & Life Sciences
Intelligent health ops
grocery
Consumer Packaged Goods
Drive smarter CPG value chains
manufacturing
Manufacturing
Quality and compliance management

Digitate Named a G2 Leader in Enterprise Grid® Report for AIOps Platforms

Resources

Resources
analytics
Analyst Reports
Discover top industry analysts report
live_tv
Webinars & Events
On-demand sessions
podcasts
Podcasts
Explore our upcoming and recorded podcast
finance
ROI
Forrester Total Economic Impact™ study
donut_small
Infographics
Discover the capabilities of ignio™’s AI solutions
rss_feed
Blogs
Insights & thought leadership
file_copy
Case Studies
Customer success stories
article
White Papers and POV
Research & analysis
book_2
e-Books
eBooks provide insights into intelligent automation
menu_book ️
Reference Guides
Guides cover AIOps and SAP automation

Agentic AI and the Future of Enterprise IT

Explore more

Support

Support & Services
support_agent
Services and Support
Discover Digitate Service
menu_book ️
Documentation
Product & developer guides
diversity_2
Community
Connect, Share, & Exchange
request_quote
Pricing
ignio capability based pricing
security ️
Trust Center
Digitate policies on security, privacy, and licensing
Agreements
Global Compliance
Security and Privacy

Digitate Delivers Unmatched Value By Streamlining ITOps

Explore more

Company

Company
globe_asia
Leadership
Our story & meet the executive team
newspaper
Newsroom & Press
Announcements & media
school
Academy
Evolve your skills and get certified
contact_mail
Contact Us
Get in touch or request a demo
handshake ️
Partners
Alliances & ecosystem
Channel Partner
Technology Partner
Integration
Marketplace

Digitate Recognized as Solutions Partner from Microsoft

Explore more

Search
Request a Demo
Contact Us
Products

What we solve

Digitate’s empowers organizations to transform their operations with intelligence, insights, and actions.​

Platform Overview
Products

ignio AIOps

Redefining IT operations with AI and automation

  • ignio Observe
  • Cloud Visibility and Cost Optimization
  • Business Health Monitoring
  • IT Event Management

ignio AI.Workload Management

Enabling predictable, Agile and Silent batch operations in a closed-loop solution

  • Business SLA Prediction

ignio AI.ERPOps

End-to-end automation for incidents and service requests in SAP

  • IDoc Management for SAP

ignio AI.Digital Workspace

Autonomously detect, triage and remediate endpoint issues

​ignio Cognitive Procurement

AI-based analytics to improve Procure-to-Pay effectiveness

ignio AI.Assurance

Transform software testing and speed up software release cycles

Platform

What we do

Digitate helps enterprises improve the resilience and agility of their IT and business operations with our SaaS–based platform.

Platform Overview
Platform

ignio™ Platform

ignio™, Digitate’s SaaS-based platform for autonomous operations, combines observability and AIOps capabilities to solve operational challenges

Industries

Autonomous IT Solutions for the Modern Industry

  • BFSI
  • Retail
  • Healthcare & Life Sciences
  • Travel & Hospitality
  • Consumer Packaged Goods

AI Agents

ignio’s AI agents, with their ability to perceive, reason, act, and learn deliver measurable business value and transform IT operations.​

  • AI Agent for IT Event Management
  • AI Agent for Incident Resolution
  • AI Agent for Cloud Cost Optimization
  • AI Agent for Proactive Problem Management
  • AI Agent for Business SLA Predictions

Resources

Analyst Reports

Discover what the top industry analysts have to say about Digitate

Blogs

Explore Insights on Intelligent Automation from Digitate experts

ROI

Get Insights from the Forrester Total Economic Impact™ study on Digitate ignio

Case Studies

Learn how Digitate ignio helped transform the Walgreens Boots Alliance

Trust Center

Digitate policies on security, privacy, and licensing

e-Books

Digitate ignio™ eBooks Provide Insights into Intelligent Automation

Infographics

Discover the Capabilities of ignio™’s AI Solutions

Reference Guides

Guides cover AIOps and SAP automation examples, use cases, and selection criteria

White Papers and POV

Discover ignio White papers and Point of view library

Webinars & Events

Explore our upcoming and recorded webinars & events

About Us

Who we are

At Digitate, we’re committed to helping enterprise companies, realize autonomous operations.

Integration
Channel Partner
Technology Partner
Azure Marketplace
Company

Leadership

We’re committed to helping enterprise companies realize autonomous operations

Newsroom

Explore the latest news and information about Digitate

Partners

Grow your business with our Elevate Partner program

Academy

Evolve your skills and get certified

Contact Us

Get in touch or request a demo

Request a Demo
Digitate - Autonomous Enterprise Software
Products

What we solve

Digitate’s empowers organizations to transform their operations with intelligence, insights, and actions.​

Platform Overview
Products

ignio AIOps

Redefining IT operations with AI and automation

  • ignio Observe
  • Cloud Visibility and Cost Optimization
  • Business Health Monitoring
  • IT Event Management

ignio AI.Workload Management

Enabling predictable, Agile and Silent batch operations in a closed-loop solution

  • Business SLA Prediction

ignio AI.ERPOps

End-to-end automation for incidents and service requests in SAP

  • IDoc Management for SAP

ignio AI.Digital Workspace

Autonomously detect, triage and remediate endpoint issues

​ignio Cognitive Procurement

AI-based analytics to improve Procure-to-Pay effectiveness

ignio AI.Assurance

Transform software testing and speed up software release cycles

Platform1

What we do

Digitate helps enterprises improve the resilience and agility of their IT and business operations with our SaaS–based platform.

Platform Overview
Platform

ignio™ Platform

ignio™, Digitate’s SaaS-based platform for autonomous operations, combines observability and AIOps capabilities to solve operational challenges

Industries

Autonomous IT Solutions for the Modern Industry

  • BFSI
  • Retail
  • Healthcare & Life Sciences
  • Travel & Hospitality
  • Consumer Packaged Goods

AI Agents

ignio’s AI agents, with their ability to perceive, reason, act, and learn deliver measurable business value and transform IT operations.​

  • AI Agent for IT Event Management
  • AI Agent for Incident Resolution
  • AI Agent for Cloud Cost Optimization
  • AI Agent for Proactive Problem Management
  • AI Agent for Business SLA Predictions

Resources

Analyst Reports

Discover what the top industry analysts have to say about Digitate

Blogs

Explore Insights on Intelligent Automation from Digitate experts

ROI

Get Insights from the Forrester Total Economic Impact™ study on Digitate ignio

Case Studies

Learn how Digitate ignio helped transform the Walgreens Boots Alliance

Trust Center

Digitate policies on security, privacy, and licensing

e-Books

Digitate ignio™ eBooks Provide Insights into Intelligent Automation

Infographics

Discover the Capabilities of ignio™’s AI Solutions

Reference Guides

Guides cover AIOps and SAP automation examples, use cases, and selection criteria

White Papers and POV

Discover ignio White papers and Point of view library

Webinars & Events

Explore our upcoming and recorded webinars & events

About Us

Who we are

At Digitate, we’re committed to helping enterprise companies, realize autonomous operations.

Integration
Channel Partner
Technology Partner
Azure Marketplace
Company

Leadership

We’re committed to helping enterprise companies realize autonomous operations

Newsroom

Explore the latest news and information about Digitate

Partners

Grow your business with our Elevate Partner program

Academy

Evolve your skills and get certified

Contact Us

Get in touch or request a demo

Request a Demo