Skip to content
IDC MarketScape · Worldwide AIOps 2026 - Digitate Named a Leader in AIOpsDOWNLOAD NOW
Webinar: ACI worldwide showing operational resilience for digital paymentsWATCH NOW
Reimagining IT Operations: The Role of AI Agents in Modern IT Teams WATCH NOW
Enterprise AI & Automation Software Solutions - Digitate
Main Menu
  • Products
      ignio Products
      network_intel_node
      AIOps
      Observe & resolve
      IT Event Management
      Resolve events & incident management at scale
      Cloud Cost Optimization
      Reduce cloud spend with intelligent analysis
      Business Health Monitoring
      Real-time business KPI tracking & alerting
      Observe
      Full-stack observability & anomaly detection
      avg_pace ️
      Workload Management
      SLA predictions
      Business SLA Prediction
      Predict and prevent SLA breaches proactively
      settings ️
      ERPOps
      SAP integration
      IDoc Management for SAP
      Automate SAP IDoc error resolution end-to-end
      devices ️
      Digital Workspace
      Employee ops
      Platform
      ignio™ Platform
      SaaS-based autonomous operations platform combining observability and AIOps to solve enterprise challenges.
      Platform Overview →
      AI Agents
      auto_awesome
      AI Agents
      ignio AI Agents for autonomous enterprise
      AI Agent for IT Event Management
      AI Agent for Incident Resolution
      AI Agent for Cloud Cost Optimization
      AI Agent for Proactive Problem Management
      AI Agent for Business SLA Predictions
      IDC MarketScape 2026

      Digitate Named a Leader in AIOps — Worldwide

      🏆
      An IDC MarketScape Leader Worldwide 2026

      Discover why IDC recognized Digitate as a Leader in AIOps. Get the full analyst report and see how ignio™ delivers unified observability & autonomous operations.

      Download Report →
  • Industries
      Industries
      account_balance
      BFSI
      BFSI AI Operations
      shopping_bag_speed ️
      Retail
      Supply chain intelligence
      travel
      Travel & Hospitality
      Enhance travel and hospitality
      health_metrics
      Healthcare & Life Sciences
      Intelligent health ops
      grocery
      Consumer Packaged Goods
      Drive smarter CPG value chains
      manufacturing
      Manufacturing
      Quality and compliance management

      Digitate Named a G2 Leader in Enterprise Grid® Report for AIOps Platforms

  • Resources
      Resources
      analytics
      Analyst Reports
      Discover top industry analysts report
      live_tv
      Webinars & Events
      On-demand sessions
      podcasts
      Podcasts
      Explore our upcoming and recorded podcast
      finance
      ROI
      Forrester Total Economic Impact™ study
      donut_small
      Infographics
      Discover the capabilities of ignio™’s AI solutions
      rss_feed
      Blogs
      Insights & thought leadership
      file_copy
      Case Studies
      Customer success stories
      article
      White Papers and POV
      Research & analysis
      book_2
      e-Books
      eBooks provide insights into intelligent automation
      menu_book ️
      Reference Guides
      Guides cover AIOps and SAP automation

      Agentic AI and the Future of Enterprise IT

      Explore more
  • Support
      Support & Services
      support_agent
      Services and Support
      Discover Digitate Service
      menu_book ️
      Documentation
      Product & developer guides
      diversity_2
      Community
      Connect, Share, & Exchange
      request_quote
      Pricing
      ignio capability based pricing
      security ️
      Trust Center
      Digitate policies on security, privacy, and licensing
      Agreements
      Global Compliance
      Security and Privacy

      Digitate Delivers Unmatched Value By Streamlining ITOps

      Explore more
  • Company
      Company
      globe_asia
      Leadership
      Our story & meet the executive team
      newspaper
      Newsroom & Press
      Announcements & media
      school
      Academy
      Evolve your skills and get certified
      contact_mail
      Contact Us
      Get in touch or request a demo
      handshake ️
      Partners
      Alliances & ecosystem
      Channel Partner
      Technology Partner
      Integration
      Marketplace

      Digitate Recognized as Solutions Partner from Microsoft

      Explore more
Request a Demo
Request a Demo
Enterprise AI & Automation Software Solutions - Digitate
article Blog

Transforming visualizations with time and technology

By Preeti Nair
  • AI/GenAI
🕒 11 min read

There is an ever-increasing focus on collecting and analysing data in almost all industry verticals ranging from retail and hospitality to banking and finance. But today’s businesses struggle when it comes to understanding data or data-driven insights. The data is too much to consume, and the data-driven insights are too complex to process. This is creating a rampant gap between the potential of data analytics and its adoption by businesses. Data visualization can act as a very effective vehicle to bridge this gap. Data visualization today is not just limited to generating reports and dashboards, instead, it is becoming a system of engagement for the end-user to get familiar with the data and make use of the data in the best possible way.

Data visualization has come a long way. Its evolution has been driven by the advances in technology, the advances in data, and the advances in the creative ways in which businesses are using data.

  • Before the advancement of modern technology, early visualizations of pre-20th century primarily relied on simple visualization representations such as tables, charts, and maps.
  • The 20th century then saw more standardized techniques of static charts. The data was represented using tools such as line charts, bar charts, pie charts, scatter plots. These representations allowed users to visualize data in a structured and comprehensible manner.
  • Advances in computer graphics in the late 20th century then paved the way to graphical user interfaces. Data visualization entered the space of dynamic and interactive visualization.
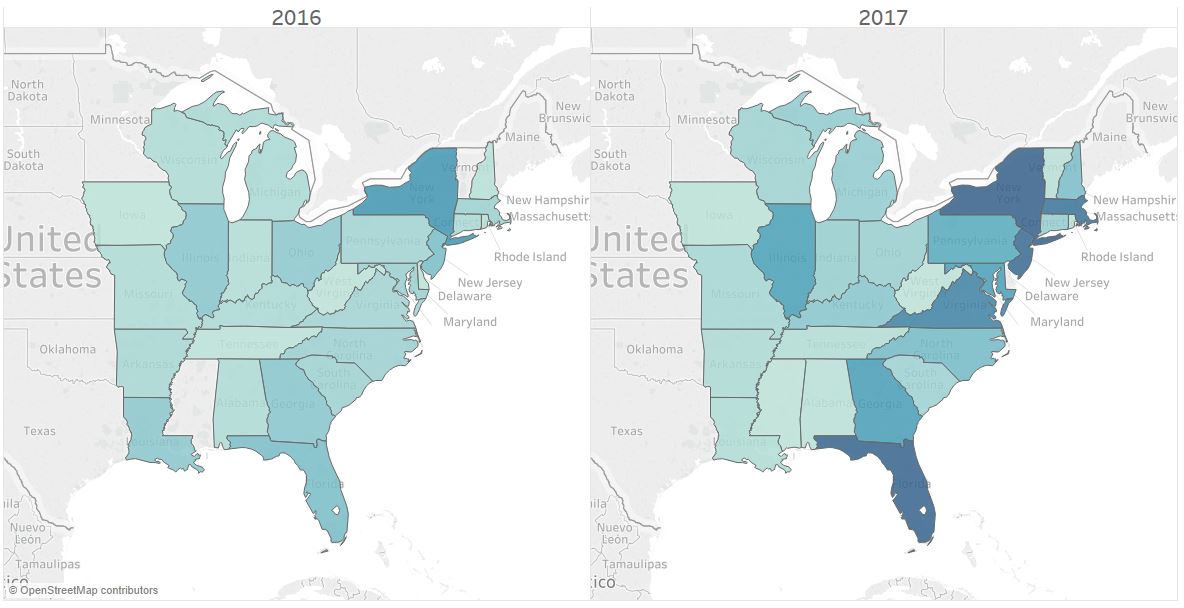
  • The rise of bigdata, led to greater depth and sophistication in visualizing multi-dimensional and complex data sets through heatmaps, treemaps, network graphs, and 3-D visualizations. Platforms such as D3.js, and tools such as Power BI and Tableau enabled users to interpret massive amounts of data quickly and intuitively.


References: https://commons.wikimedia.org/wiki/File:1786_Playfair_-_1_Chart_of_all_the_import_and_exports_to_and_from_England_from_the_year_1700_to_1782.jpg; https://www.syskit.com/blog/power-bi-dashboards-vs-reports/; https://www.highcharts.com/demo/highcharts/bubble; https://blog.4d.com/how-to-use-google-charts-with-4d/


Going forward, data visualization is headed to revolutionize how we interact with data by creating immersive, interactive, and personalized experiences. Different factors are playing a crucial role in shaping the future of data visualization. In this blog, we discuss three critical aspects that are driving the trends in data visualization.

  • Advances in observability and big data — Businesses have an increasing focus on observability. Data is getting collected and analysed across all layers of business, application, and infrastructure. The need to analyse such large, complex, and multi-dimensional data is influencing the future of data visualization.
  • Advances in AI — Like most industries, AI has a strong influence in shaping the future of data visualization. New possibilities are opening with low-code and no-code development and automated UI generation. Generative AI is making technology accessible in never-before-seen ways.
  • Advances in technology — Technology advances are driving the trends to create animated, interactive, and immersive visualizations.

In this blog, we discuss some of these trends that are shaping the data visualization of today and tomorrow.

Trends Impacted by Advancements in Observability and Big data

Data observability is the process to understand, measure, and track the health of data as it flows through the system to ensure accurate and trustworthy decision making. Data observability drives 3 key trends in data visualization.

360-degree views — With so much data being collected, there is an increasing focus on presenting a comprehensive 360-degree view of the system by connecting the dots across a wide-variety of data sources. Various industries are making use of such views and are coming with more requirements for such bird’s-eye views. Below are some examples:

  • CFOs of ecommerce websites often make use of such views to quickly glance on the area from where maximum hits come to the website. Below figure shows one such view where the darker areas indicate higher website visits.


Reference: https://www.dataself.com/content/uploads/2018/05/WebSite2.jpg


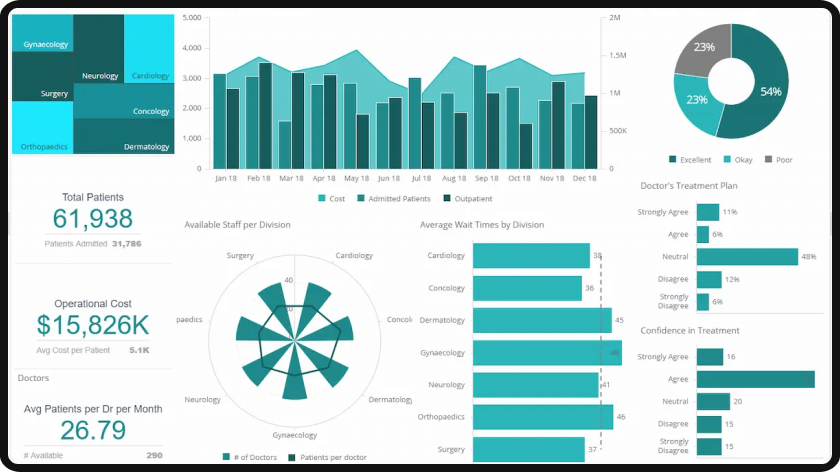
  • Hospitals make use of such views to get a clear view of their overall performance and identify the gaps to improve the overall patient experience. Below is an example of one such view.


Reference: https://integrio.net/static/1542bae35ac6cdd1a583bdeeada0bddd/img-medical-visits.png


  • Aviation industry makes use of such views to understand the performance of an airport in terms of delays and cancellation. Below figure shows one such example.


Reference: https://www.heavy.ai/demos/flights


AI, machine learning and IoT together can enhance the capability of 360-degree visualization making it a crucial element in the world of monitoring and management. One of the major challenges in 360-degree visualization is that the target audience can be different for a single holistic view shown as part of the data representation and grouping the information together on a single pane should reach the right audience.

Real-time visualization — Providing a real-time view of data is another fast-picking visualization trend. It is often used to bring transparency, track inconsistencies, and better understand the current system state. Flight tracking presents an interesting example of such visualization that gives a real time picture of number of flights flying across at a particular point in time.


Reference: https://www.flightradar24.com/


With real time information, the quick data processing and immediate visualizations help users to conclude on any business-critical decisions. Some of the common challenges in real time data visualization is:

  • The volume of data coming into the system, this can sometimes be overwhelming for the user to process and understand.
  • The response time or the time taken by the data to process and update the results can vary based on the incoming load. For example, in stock market, a delay of just a few milliseconds can mean the difference between a profitable and unprofitable trade.
  • If the quality of the data is low and contains erroneous or missing information, can completely change the final visualization which in turn confuse the user on the authenticity and correctness of what is shown on the dashboard.

Intuitive narrow-downs — Once an effective visualization is presented to the end user, based on the user persona who is analysing the charts or graphs there should be handles to highlight the area which needs attention. There is an increasing demand to provide ways to aggregate data, filtering out the unwanted data, concatenate multiple charts/graphs together for faster decision making, and other such tools to make it easy to narrow down the insights of interest.

Trends Impacted by the Advances in AI

AI is empowering the UI designers and developers to focus on core creativity by giving them several tools as disposal. GenAI will play a pivotal role in augmenting data visualization platforms where AI and user can collaborate on the same canvas, empowering users to curate their own experiences.

Automated dashboard creation — AI/ML algorithms are heading towards automating the process of data visualization. These algorithms can generate visualizations that best present the data and data-driven insights. Some tools are already available that help to quickly convert data into dashboards without much manual intervention. One such tool is Ajelix BI that simplifies the dashboard creation in just 4 steps. Below figure presents one such dashboard.


Reference: https://ajelix.com/bi/analytics-dashboard-software/


Natural language interactions — Advances in Natural Language Processing (NLP) and Natural Language Generation (NLG) are paving the way for simpler interaction metaphors where users can interact in natural language queries through voice or text. Instead of staring at elaborate dashboards, data visualization is likely to head towards simpler interfaces allowing users to simply ask for the information of interest.

Customization and personalization — AI is sharpening the ability to analyze user behavior and assess user’s preferences. This can be leveraged in powerful ways to create adaptive visual experiences. AI can adjust the dashboard layout, the content, the visualization metaphors, etc., based on the user’s behavior and preferences.

No-code/low-code tools- AI is offering low-code and no-code solutions to create dashboards. This will make it very easy to create insightful visualizations without the technical skills of data visualization. There are several tools in the market that are now offering such capabilities. With Polymer’s AI capability, data can be quickly transformed into customized dashboards. Other similar tools offering a no-code or low-code way are ‘VisualizeFree’, ‘Qlik sense’, ‘DronaHQ’ etc. An interesting example in this space is “Goodgigs”, a marketplace for freelancers, that is built completely using a no-code app builder.

Trends Impacted by the Advances in Technology

Technology has played a strong driving force behind the evolution of data visualization, and it continues to do so. With powerful computing systems, sophisticated algorithms, and advanced visualization software, data visualization is reimaging the way end users engage with data and data-driven insights.

Mobile-friendly visualization — Today, mobile impressions are often the first impressions. Mobile-friendly and mobile-optimized visualization continue to drive trends in data visualization. There is an increasing need to focus on properties that allow visualization that can be viewed seamlessly across multiple platforms.


Following are some of the common challenges observed in mobile data visualization:

  • Limited interactions: Unlike laptop or other large displays, where the interactions can be using mouse or multiple other keyboard keys, it is difficult to show the same visualization in a mobile device in the as-is format. Because of the limited estate, the visualizations should be altered to bring in a view where fewer interactions are needed. Users commonly face issues such as the fat finger problem or the no-hover design, which limits the interactions in mobile device. Consider this example scenario: Emily is a mother of a 10-year-old girl. While coming back from work, she sees her daughter’s annual assessment report on the school’s application. There are large number of parameters in which the student is assessed, and parents must provide an approval or decline if there are any clarifications required. While Emily is still checking the report, due to shaking of the mobile phone in the bus, she accidentally chooses the accept button which send a confirmation to teacher that no clarifications are required which might not be the case.
  • Misleading visualizations: There are scenarios where limitations in the screen space have led to designs that compromise with the ease of use of information that is shown to the user. Example scenario: Olivia has been prescribed to take insulins when her sugar level reaches a certain limit. Her blood sugar monitoring device sends data to the health app to track the details. When she checks the health app, she is confronted with a complicated interface which brings up other health information such as blood pressure, exercise details, energy levels, screen time, sleep cycle, steps etc. This creates frustration of not finding the relevant information quickly and easily.

Animated and interactive visualization — Static data visualization is no longer sufficient. The attention span of the users is reducing. Animations provide an effective tool to catch-up with this trend to keep the user engaged. Basic data animations have been present since last few decades, but they offered flashy and imprecise visuals. Latest advancements in animated and interactive visualizations provide effective vehicles to summarize insights without excessive text and to provide interactive drill-downs into the areas of interest.

AR/VR immersive experiences — Traditional data visualization technologies restrict the facts and imaginations derived from the data. This problem further accentuates as the data cuts across different layers of technology and business. Many data scientists strongly believe that AR/VR can transform the way users interact with and interpret data-driven insights. AR/VR driven visualizations are still in the initial stages, but it is certainly gaining popularity. Several tools are now enabling creation of creative AR/VR experiences.

  • Flow Immersive offers interactive experiences by using AI and 3D visualization to better present and understand data.
  • Virtualitics is one of the leaders in the virtual reality space which is helping users with 3D visualization by ingesting big data with hundreds and thousands of metrics.


Reference: https://wear-studio.com/vr-ar-data-visualization/


  • 3Data focuses on visualizing Enterprise IT, where the devices of an organization can be displayed with hundreds of datapoints. They have a smart assistance called “Apollo” which operates over voice commands.


Reference: https://wear-studio.com/vr-ar-data-visualization/


Conclusion

The future of data and driven-insights is visual. Data continues to grow in volume and complexity, and so does the number of people using it. By embracing emerging trends, data visualization is all set to play a powerful role in data storytelling and driving data-driven decision making.

Author

Preeti Nair

Product Manager | Digitate

LinkedIn

Recent Blogs

How Pharma IT Teams Can Achieve Continuous GxP Compliance and Audit Readiness

July 28, 2026

Autonomous IT for Travel and Hospitality: Revolutionizing Guest Experiences and Operational Resilience

July 21, 2026

Why Modern Enterprises Still Get Blindsided And How Business Process Observability Changes That

May 31, 2026

Why Autonomous IT Is Becoming Essential for the Modern Industry

May 28, 2026

Autonomous IT for Life Sciences: From Downtime to Compliance-Ready Resilience

May 19, 2026

Digitate is Positioned as a Leader in the IDC MarketScape: Worldwide AIOps 2026 Vendor Assessment

April 28, 2026

Get started with Digitate

See ignio in action, talk to our team, or explore how partners grow with Digitate’s Elevate program.
play_circle Request a Demo mail Contact Us handshake Become a Partner

Stay in the loop

Get the latest on AI automation, product updates & industry insights.
Products
  • ignio™ Platform
  • AI Agents
  • AIOps
  • Workload Management
  • ERPOps
  • Digital Workspace
Resources
  • Analyst Reports
  • Blogs
  • Case Studies
  • Podcasts
  • Webinars & Events
  • e-Books
  • White Papers and POV
  • Infographics
Services and Support
  • Service and Support
  • Pricing
  • Documentation
  • Community
  • Trust Center
  • Data Privacy Policy
  • Website Use Terms
  • Cookie Policy Notice
  • Cookies Settings
  • California Notice At Collection
Company
  • About Digitate
  • Partner With Us
  • Newsroom
  • Academy
  • Contact Us
© Tata Consultancy Services Limited, 2025. All rights reserved
Products

ignio Products
network_intel_node
AIOps
Observe & resolve
IT Event Management
Resolve events & incident management at scale
Cloud Cost Optimization
Reduce cloud spend with intelligent analysis
Business Health Monitoring
Real-time business KPI tracking & alerting
Observe
Full-stack observability & anomaly detection
avg_pace ️
Workload Management
SLA predictions
Business SLA Prediction
Predict and prevent SLA breaches proactively
settings ️
ERPOps
SAP integration
IDoc Management for SAP
Automate SAP IDoc error resolution end-to-end
devices ️
Digital Workspace
Employee ops
Platform
ignio™ Platform
SaaS-based autonomous operations platform combining observability and AIOps to solve enterprise challenges.
Platform Overview →
AI Agents
auto_awesome
AI Agents
ignio AI Agents for autonomous enterprise
AI Agent for IT Event Management
AI Agent for Incident Resolution
AI Agent for Cloud Cost Optimization
AI Agent for Proactive Problem Management
AI Agent for Business SLA Predictions
IDC MarketScape 2026

Digitate Named a Leader in AIOps — Worldwide

🏆
An IDC MarketScape Leader Worldwide 2026

Discover why IDC recognized Digitate as a Leader in AIOps. Get the full analyst report and see how ignio™ delivers unified observability & autonomous operations.

Download Report →

Industries

Industries
account_balance
BFSI
BFSI AI Operations
shopping_bag_speed ️
Retail
Supply chain intelligence
travel
Travel & Hospitality
Enhance travel and hospitality
health_metrics
Healthcare & Life Sciences
Intelligent health ops
grocery
Consumer Packaged Goods
Drive smarter CPG value chains
manufacturing
Manufacturing
Quality and compliance management

Digitate Named a G2 Leader in Enterprise Grid® Report for AIOps Platforms

Resources

Resources
analytics
Analyst Reports
Discover top industry analysts report
live_tv
Webinars & Events
On-demand sessions
podcasts
Podcasts
Explore our upcoming and recorded podcast
finance
ROI
Forrester Total Economic Impact™ study
donut_small
Infographics
Discover the capabilities of ignio™’s AI solutions
rss_feed
Blogs
Insights & thought leadership
file_copy
Case Studies
Customer success stories
article
White Papers and POV
Research & analysis
book_2
e-Books
eBooks provide insights into intelligent automation
menu_book ️
Reference Guides
Guides cover AIOps and SAP automation

Agentic AI and the Future of Enterprise IT

Explore more

Support

Support & Services
support_agent
Services and Support
Discover Digitate Service
menu_book ️
Documentation
Product & developer guides
diversity_2
Community
Connect, Share, & Exchange
request_quote
Pricing
ignio capability based pricing
security ️
Trust Center
Digitate policies on security, privacy, and licensing
Agreements
Global Compliance
Security and Privacy

Digitate Delivers Unmatched Value By Streamlining ITOps

Explore more

Company

Company
globe_asia
Leadership
Our story & meet the executive team
newspaper
Newsroom & Press
Announcements & media
school
Academy
Evolve your skills and get certified
contact_mail
Contact Us
Get in touch or request a demo
handshake ️
Partners
Alliances & ecosystem
Channel Partner
Technology Partner
Integration
Marketplace

Digitate Recognized as Solutions Partner from Microsoft

Explore more

Search
Request a Demo
Contact Us
Products

What we solve

Digitate’s empowers organizations to transform their operations with intelligence, insights, and actions.​

Platform Overview
Products

ignio AIOps

Redefining IT operations with AI and automation

  • ignio Observe
  • Cloud Visibility and Cost Optimization
  • Business Health Monitoring
  • IT Event Management

ignio AI.Workload Management

Enabling predictable, Agile and Silent batch operations in a closed-loop solution

  • Business SLA Prediction

ignio AI.ERPOps

End-to-end automation for incidents and service requests in SAP

  • IDoc Management for SAP

ignio AI.Digital Workspace

Autonomously detect, triage and remediate endpoint issues

​ignio Cognitive Procurement

AI-based analytics to improve Procure-to-Pay effectiveness

ignio AI.Assurance

Transform software testing and speed up software release cycles

Platform

What we do

Digitate helps enterprises improve the resilience and agility of their IT and business operations with our SaaS–based platform.

Platform Overview
Platform

ignio™ Platform

ignio™, Digitate’s SaaS-based platform for autonomous operations, combines observability and AIOps capabilities to solve operational challenges

Industries

Autonomous IT Solutions for the Modern Industry

  • BFSI
  • Retail
  • Healthcare & Life Sciences
  • Travel & Hospitality
  • Consumer Packaged Goods

AI Agents

ignio’s AI agents, with their ability to perceive, reason, act, and learn deliver measurable business value and transform IT operations.​

  • AI Agent for IT Event Management
  • AI Agent for Incident Resolution
  • AI Agent for Cloud Cost Optimization
  • AI Agent for Proactive Problem Management
  • AI Agent for Business SLA Predictions

Resources

Analyst Reports

Discover what the top industry analysts have to say about Digitate

Blogs

Explore Insights on Intelligent Automation from Digitate experts

ROI

Get Insights from the Forrester Total Economic Impact™ study on Digitate ignio

Case Studies

Learn how Digitate ignio helped transform the Walgreens Boots Alliance

Trust Center

Digitate policies on security, privacy, and licensing

e-Books

Digitate ignio™ eBooks Provide Insights into Intelligent Automation

Infographics

Discover the Capabilities of ignio™’s AI Solutions

Reference Guides

Guides cover AIOps and SAP automation examples, use cases, and selection criteria

White Papers and POV

Discover ignio White papers and Point of view library

Webinars & Events

Explore our upcoming and recorded webinars & events

About Us

Who we are

At Digitate, we’re committed to helping enterprise companies, realize autonomous operations.

Integration
Channel Partner
Technology Partner
Azure Marketplace
Company

Leadership

We’re committed to helping enterprise companies realize autonomous operations

Newsroom

Explore the latest news and information about Digitate

Partners

Grow your business with our Elevate Partner program

Academy

Evolve your skills and get certified

Contact Us

Get in touch or request a demo

Request a Demo
Digitate - Autonomous Enterprise Software
Products

What we solve

Digitate’s empowers organizations to transform their operations with intelligence, insights, and actions.​

Platform Overview
Products

ignio AIOps

Redefining IT operations with AI and automation

  • ignio Observe
  • Cloud Visibility and Cost Optimization
  • Business Health Monitoring
  • IT Event Management

ignio AI.Workload Management

Enabling predictable, Agile and Silent batch operations in a closed-loop solution

  • Business SLA Prediction

ignio AI.ERPOps

End-to-end automation for incidents and service requests in SAP

  • IDoc Management for SAP

ignio AI.Digital Workspace

Autonomously detect, triage and remediate endpoint issues

​ignio Cognitive Procurement

AI-based analytics to improve Procure-to-Pay effectiveness

ignio AI.Assurance

Transform software testing and speed up software release cycles

Platform1

What we do

Digitate helps enterprises improve the resilience and agility of their IT and business operations with our SaaS–based platform.

Platform Overview
Platform

ignio™ Platform

ignio™, Digitate’s SaaS-based platform for autonomous operations, combines observability and AIOps capabilities to solve operational challenges

Industries

Autonomous IT Solutions for the Modern Industry

  • BFSI
  • Retail
  • Healthcare & Life Sciences
  • Travel & Hospitality
  • Consumer Packaged Goods

AI Agents

ignio’s AI agents, with their ability to perceive, reason, act, and learn deliver measurable business value and transform IT operations.​

  • AI Agent for IT Event Management
  • AI Agent for Incident Resolution
  • AI Agent for Cloud Cost Optimization
  • AI Agent for Proactive Problem Management
  • AI Agent for Business SLA Predictions

Resources

Analyst Reports

Discover what the top industry analysts have to say about Digitate

Blogs

Explore Insights on Intelligent Automation from Digitate experts

ROI

Get Insights from the Forrester Total Economic Impact™ study on Digitate ignio

Case Studies

Learn how Digitate ignio helped transform the Walgreens Boots Alliance

Trust Center

Digitate policies on security, privacy, and licensing

e-Books

Digitate ignio™ eBooks Provide Insights into Intelligent Automation

Infographics

Discover the Capabilities of ignio™’s AI Solutions

Reference Guides

Guides cover AIOps and SAP automation examples, use cases, and selection criteria

White Papers and POV

Discover ignio White papers and Point of view library

Webinars & Events

Explore our upcoming and recorded webinars & events

About Us

Who we are

At Digitate, we’re committed to helping enterprise companies, realize autonomous operations.

Integration
Channel Partner
Technology Partner
Azure Marketplace
Company

Leadership

We’re committed to helping enterprise companies realize autonomous operations

Newsroom

Explore the latest news and information about Digitate

Partners

Grow your business with our Elevate Partner program

Academy

Evolve your skills and get certified

Contact Us

Get in touch or request a demo

Request a Demo